Download
1 / 38
380 likes | 390 Vues
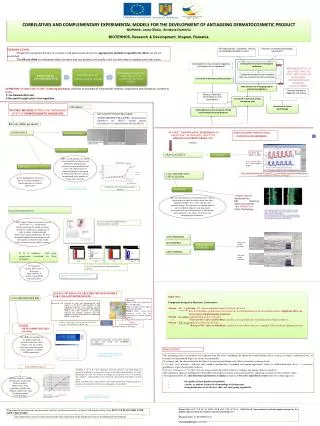
Lectures on Medical Biophysics Department of Biophysics, Medical Faculty, Masaryk University in Brno. Lectures on Medical Biophysics Department of Biophysics, Medical Faculty, Masaryk University in Brno. Biomolecular and Cellular Research Devices. Lecture Outline.

E N D
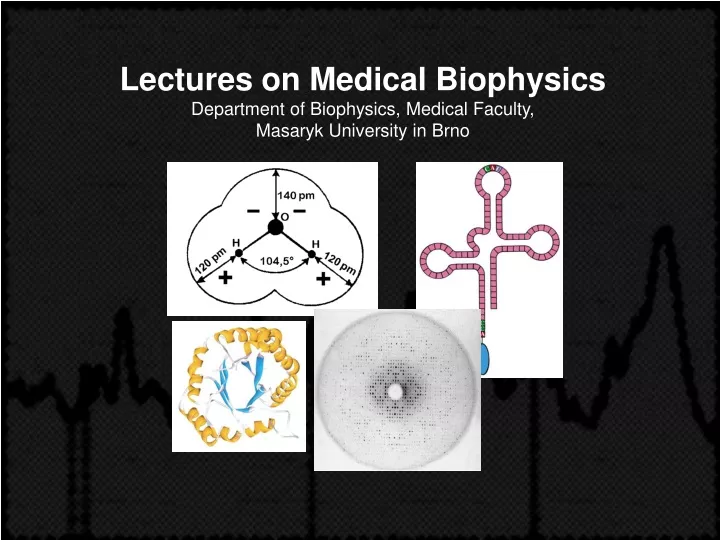
Lectures on Medical BiophysicsDepartment of Biophysics, Medical Faculty, Masaryk University in Brno
Lectures on Medical BiophysicsDepartment of Biophysics, Medical Faculty, Masaryk University in Brno Biomolecular and Cellular Research Devices
Lecture Outline • Biomolecular science – crucial importance for molecular medicine. We will deal with devices for structural studies, concentration measurement (in-vitro and in-vivo), cell membrane studies • Most common devices are based on the interactions of electromagnetic radiation with the macromolecules • VIS, UV and IR Spectrophotometers • Raman spectrometers • Circular dichroism based devices • X-ray diffraction spectrometers • Devices based on other properties of biomolecules (e.g., mechanical and electrical properties) • Electrophoresis • Cellular potentials and intra-cellular ion concentration devices
We do not deal with…. • Devices for measurement of • Osmolar concentration (measurement is based on cryoscopy), • Diffusion • Viscosity (practical exercises) • Devices for determination of secondary and tertiary structure of proteins and nucleic acids based in electrochemistry(interaction of macromolecules with electrodes is studied) • Nuclear magnetic resonance(it allows to determine chemical binding of hydrogen atoms – mentioned in lecture about MRI) • Electron spin resonance, • Centrifuges (other lecture) etc.
Biophysics and Biomolecular Research This research is mainly oriented to structural studies which allow understanding of e.g.: • Specificity of enzymatic and immunologic reactions • Effects of some pharmaceuticals (cytostatic drugs) at the molecular level. • Mechanisms of passive and active transport processes • Cellular motion • ……………..
Devices based on the interactions of electromagnetic radiation with the macromolecules
Types of Spectrophotometers • Spectrophotometers are laboratory instruments used to study substances absorbing or emitting infrared, visible and ultraviolet light, including studies of their chemical structure. • Absorption spectrophotometers: based on the spectral dependence of light absorption. • Emission spectrophotometers: The light source is the analysed substance itself, which is injected or sprayed into a colourless flame. The light emitted passes through an optical prism or grating so that the whole emission spectrum can be obtained. The frequencies present in the spectrum enable to identify e.g. present ions. • Spectrofluorimeters: light emission is evoked by light of a wavelength shorter than the wavelength of emitted light.
Absorption Spectrophotometers: Lambert-Beer's law Absorption spectrophotometry is based on the absorbance of light after passing through a layer of solution of a light absorbing substance. Its concentration can be found using the Lambert-Beer law: I = I0.10-ecx c solute concentration, x thickness of solution, I0 original light intensity, I is the intensity of light leaving the layer. The constant e (epsilon, absorption or extinction coefficient) depends on the wavelength of light, solute and solvent. Its values for common chemical compounds can be found in tables. These values are always given for a specified wavelength (usually the absorption maximum). The numerical values of the coefficient depend on how the concentration of the dissolved substance is expressed. When using mol.l-1, we speak of the molar absorption coefficient.
The ratio of transmitted and incident light intensities is called transmittance (transparency). The log of reciprocal of the transmittance is called the absorbance A. Thus, the absorbance is directly proportional to the concentration of the solution and thickness of the absorbing solution layer. A = e.c.x
Types of Absorption Spectrophotometers • According to their construction, spectrophotometers can be divided into single- and double-beam types. • In single-beam spectrophotometers one beam of light passes through the reference and then the measured sample (the cuvettes containing the solutions must be movable). In double-beam spectrophotometers one beam of light passes through the measured sample and the second through the reference (or blank) sample. Double-beam instruments allow substantially faster measurements, but they are more expensive. In simple instruments, the setting of wavelength is done manually. In more sophisticated instruments, the setting is done automatically so that it is possible to record directly absorption curves, i.e. plots of absorbance versus light wavelength in a given medium.
Single-beam spectrophotometer The light source (1) is a tungsten lamp. Its polychromatic light passes through a condensor (2) and reflects from a mirror (3) to the input slit (4) of the monochromator (parts 4 to 8, plus 12). The light is collimated (5) onto a reflection optical grating (6) which forms a colour spectrum. An almost monochromatic light is projected by an objective (7) onto the exit slit (8) of the monochromator.
Single-beam spectrophotometer The grating is rotated by means of a wavelength selection control (12) to choose wavelength directed into the exit slit.The light beam passes through a cuvette (9) with the sample. Intensity of the transmitted light is measured by a photodetector (10, 11). Signal from the detector is amplified by an amplifier (13). The value of absorbance is displayed (14). Intensity of the light transmitted through the reference solution is always compared with the intensity of the same beam passed through the measured sample.
NIR = near infrared Modern UV/VIS/NIR Spectrophotometer Light of one selected wavelength or alsowhole transmitted spectrum can be measured
UV Absorption spectrophotometry • The ultraviolet (UV) light is absorbed by various compounds, namely by those having conjugate double bonds. Both proteins and nucleic acids absorb strongly UV light, which can be used for their investigation. • The amino acids tryptophan and tyrosine have absorption maximum at about 280 nm. Phenylalanine at 255 nm. • Nucleotides (nitrogen bases) have absorption maximum in the range of 260 - 270 nm. • Chromophores – their absorption properties vary according to chemical composition of the medium.
Absorption spectra of amino acids Wavelength [nm] According: http://www.gwdg.de/~pdittri/bilder/absorption.jpg
Hypochromic Effect (HE) • Absorption of light is influenced by dipole moments of chemical bonds which interact with photons. Stochastically (randomly) oriented dipole moments (denatured protein) absorb light better than in the state with ordered structure (helices). In proteins, the HE is derived from peptide bonds, which have UV absorption maximum at about 190 nm. • The double helix of DNA absorbs UV light less than when the molecule is denatured. • Helicity – percentage of ordered parts of the macromolecule
Hypochromic effect in polyglutamic acid. At pH 7 this polypeptide forms random coil (1), at pH 4 it adopts helical structure (2). Absorption maximum of peptide bonds is lowered due to their spatial arrangement. e is the molar absorption coefficient and l is wavelength of UV light. [according Kalous and Pavlíček, 1980]
IR Spectrophotometry • IR interacts with rotational and vibration states of molecules. Complex molecules can vibrate or rotate in many different ways (modes). Various chemical groups (-CH3, -OH, -COOH, -NH2 etc.) have specific vibration and rotation frequencies and thus absorb IR light of specific wavelength. • Therefore, infrared absorption spectra have many maxima. A change in chemical structure is manifested as changes of the position of these maxima.
Infrared transmittance spectrum of hexanehttp://www.columbia.edu/cu/chemistry/edison/IRTutor.html
Raman spectrometry • Rayleigh scattering of light. Interaction of photons with molecules can take place with no or very little change of wavelength. The intensity of the scattered light depends on molecular weight and also scattering angle which can be used for estimation of the macromolecule shape. • Raman spectrometry. In scattering of photons a small change of wavelength occurs (wavelength shift), which is caused by a small decrease or increase of scattered photon energy during transitions from original to changed vibration or rotational states of interacting molecules. These states can change due to structural changes of molecules. • Thus, changes in the Raman spectra (signal intensity vs. wavelength shift or wave number values) reflect conformational changes of molecules.
proteins background Signal intensity Wave number [cm-1] Raman spectrometry Raman spectrum of giant chromosomes of a midge (Chironomus). At selected wave number values it is possible to run Raman microscopy. Excited by 647.1 nm laser light. According to: http://www.ijvs.com/volume2/edition3/section4.htm
Micrograph in normal white light (chromosome Chironomus Thummi Thummi) Confocal Raman micrograph showing DNA backbone (vibration at 1094 cm-1) Confocal Raman micrographshowing the presence of aliphatic chains in proteins at 1449 cm-1 according: http://www.ijvs.com/ volume2/edition3/section4.htm
Optical rotation dispersion - optional Inoptical rotation dispersion method (ORD)we measure dependence of optical activity on the light wavelength. This method was replaced by more sensitive method of circular dichroism (CD), which gives similar information.
Wavelength [nm] Circular Dichroism (CD) - optional • Measurements ofoptical activity(ability to rotate plane of polarised light). Conformation changes of molecules can be followed as changes of optical activity using a special polarimeter. • We compare absorbances of laevorotatory and dextrorotatory circularly polarised light, the wavelength of which is near the absorption maximum of the protein. • CD can be used also for studying the structure of nucleic acids. The figure shows changes of elipticity of a synthetic polypeptide containing long poly-glu sequences after addition of the trifluoroethanol (TFE), which increases percentage of thea-helix. http://www-structure.llnl.gov/cd/polyq.htm
X-ray source Protein crystal Diffracted X-rays X-ray diffraction Spectrometers The crystal lattice acts on X-rays as an optical grating on visible light. Diffraction phenomena occur and diffraction patterns appear. These patterns can be mathematically analysedto obtain information about distribution of electronsin molecules forming the crystal. http://cwx.prenhall.com/horton/medialib/media_portfolio/text_images/FG04_02aC.JPG
Electron density map of an organic substance calculated from an X-ray crystallogram
The crystallogram of B-DNA obtained in 1952 by Rosalind E. Franklin, on the basis of which Watson and Crick proposed the double-helix model of DNA structure. F C W
Methods based on measurements of mechanical and electrical properties of macromolecules Size and shape of macromolecules can be studied by measurement of: • Osmotic pressure (size, see lecture ″Thermodynamics and life″) • Diffusion coefficient (size, see lecture ″Thermodynamics and life″) • Viscosity (shape, see practical exercises) • Sedimentation (size, see lecture ″Devices for electrochemical analysis. Auxiliary laboratory devices″ We can also use: • Electron microscopy (size and shape, see lecture ″Microscopy″) • Chromatography - molecular sieve effect in gel permeation chromatography (see chemistry) • Electrophoresis (end of this part of lecture)
Electrophoretic Device http://library.thinkquest.org/C0122628/showpicture.php?ID=0064
Electrochemical properties of colloids Colloids are solutions containing particles 10 – 1000 nm in size. Some molecular and micellar colloids are polyelectrolytes with amphoteric properties. These ampholytes behave like both bases and acids depending on pH of the medium. Resulting charge Isoelectric point (Ip) In proteins changes the number of –NH3+ and –COO- groups.
Origin of electric double layer on the surface of colloid particle Two mechanisms: • Ion adsorption (also in hydrophobic colloids) • Electrolytic dissociation (prevails in hydrophilic colloids) The double layer on the particle surface differs in concentrated and rarefied electrolytes. In rarefied electrolytes we can distinguish between stable, diffusive and electroneutral region in the whole ion cloud around the particle. Electrokinetic potential – z (zeta)-potential
Electrophoresis • Electrophoresis – movement of charged molecules in an electric field. In uniform rectilinear motion of spherical particles with radius r, the electrostatic force acting on the particle is in equilibrium with the frictional force arising from the viscosity. The frictional force is given by Stokes formula: F = 6.p.r.h.v where v is particle velocity and h the dynamic viscosity of medium. • The electric field acts on the particle by force: F = z.e.E where z is number of elementary charges of the particle, e is the elementary charge (1,602.10-19 C) and E is intensity of electric field in given place. • Since both forces are equal, velocity of the particle equals:
Electrophoretic mobility • The electrophoretic mobility u does not depend on intensity of the electric field. It is defined as a ratio of particle velocity and the electric field intensity. It holds: Note. Electrophoresis with sodium dodecylsulphate.This compound carrying one negative elementary charge binds in defined way to proteins and eliminates their own electric charge. Protein molecules then move with different velocities only due to their different radii.
Measurement of membrane potentials • Membrane potentials are measured by means of glass microelectrodes, i.e. glass capillaries with very fine narrow tips. The diameter of the opening in the end of the tip must be below 1 mm to avoid substantial damage to the cell. The inner space of the capillary tip is filled by KCl solution with concentration of 3 mol.l-1. A silver chloride electrode placed in the extracellular space is used as reference electrode. • Glass microelectrodes are characterised by high internal resistance (about 10 MW), so we need high quality amplifiers for the measurement to avoid distortion of the voltage to be measured.
Experimental setup for measurement of membrane potential by capillary microelectrodes. amplifier oscilloscope cell When using glass microelectrodes, it is possible to measure also other electrochemical parameters of the cells and membranes, e.g., concentrations of some ions. They can be prepared as ion selective electrodes for Na+, K+, Ca2+, H+etc.
Patch-clamp Method A blunt glass microelectrode clings to the surface of the cell or an isolated part of the biological or artificial membrane. The opening at the end of the microelectrode is completely sealed by the membrane “patch” and the measured electric voltages or currents thus relate to only a small part of the membrane, in which a small number of ion channels are found. Some ion channels may be closed or opened in advance, the microelectrode filling may even contain ligands capable of interaction with ion channels, and in general any substances that can affect the function of the membrane. This discovery enabled to examine the activity of the individual or small groups of ion channels.
Author: Vojtěch MornsteinContent collaboration and language revision: Viktor Brabec, Carmel J. CaruanaPresentation design: Lucie MornsteinováLast revision: September 2015