Download
1 / 21
220 likes | 233 Vues
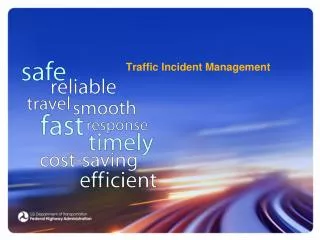
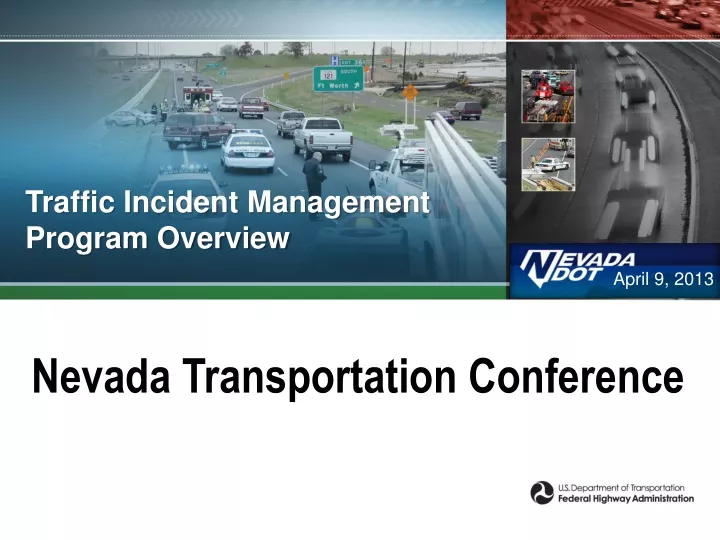
Traffic Incident Management Program Overview. April 9, 2013. Nevada Transportation Conference. Presentation Topics. National TIM Program Business Case for TIM SHRP2 TIM Training. Traffic Incident Management.

E N D
Traffic Incident Management Program Overview April 9, 2013 Nevada Transportation Conference
Presentation Topics • National TIM Program • Business Case for TIM • SHRP2 TIM Training
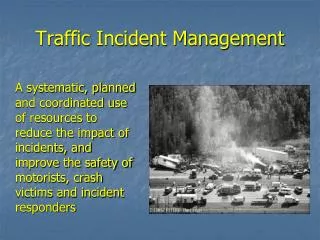
Traffic Incident Management TIM consists of a planned and coordinatedmulti-disciplinary process to detect, respond to, and clear traffic incidents so that traffic flow may be restored as safely and quickly as possible Effective TIM reduces the duration and impacts of traffic incidents and improves the safety of motorists, crash victims and emergency responders
National TIM Program Vision… • Reduce or eliminate responder & motorist injuries & fatalities • Promote rapid incident clearance • TIM Programs that benefit states, corridors& regions • Emphasize TIM as a system operations “core mission” • Measure performance andimproved TIM responses and programs • Standardize Training
Quantifying the Problem - Motorist Safety Business Case for TIM Evolving Business Case: Why TIM? Every hour, car crashes kill an average of four people on America's roads. “Traffic crashes really need to be moved to the forefront of the American discussion as the public safety (and) health threat that they are," observes AAA.
Business Case for TIM Quantifying the Problem - Responder Safety • Highway: 100 /year + 20,000 injured • Fire/Rescue & EMS: 6 to 8 /year • Law Enforcement: 10 to 12 /year • Tow/Recovery: 50 /year Source: Emergency Responder Safety Institute Evolving Business Case: Why TIM? Average annual number of responders struck and killed nationally while working in or near moving traffic:
Evolving Business Case: Why TIM? Societal Costs The emotional toll for those who lose a friend or loved one in a crash has a steep financial impact – ~$6 million per fatal accident • Delay • Annual cost of congestion & traffic crashes: $300 B • Economy • Global Supply Chain • Response Services Evolving Business Case: Why TIM?
Quantifying the Problem - Secondary Incidents • Estimated 20-25% of all incidents are secondary • They generate ~18 percent of accident fatalities • The likelihood of a secondary incident increases ~3% for every minute • An incident lasting 35 minutes or more has almost a 100% likelihood of a secondary incident occurring • Often more severe than the primary incident Evolving Business Case: Why TIM?
Quantifying the Problem - Responder Costs Courtesy of the Washington DOT
Quantifying the Problem - Freight Issues Evolving Business Case: Why TIM? • Parking and rest areas • High volume long haul trucking • Lack of alternate route options
Average Daily Long-Haul Freight Truck Traffic on the National Highway System: 2009 Evolving Business Case: Why TIM? 2009 ~14,000 per day ~25,000 per day Our highway system handled the movement of 44 million tons of freight (on average), worth $40 billion, each day in 2009.
Projected Average Daily Long-Haul Freight Truck Traffic - 2040 Evolving Business Case: Why TIM? 2040 ~20,000 per day projections indicate that these numbers will climb to approximately 74 million tons and $108 billion per day by the year 2040 ~40,000 per day
Are we making a difference? Measuring Success • Nevada TIM Coalitions • Reno/Carson City/Tahoe area, • Las Vegas, and • Statewide What Gets Measured Gets Performed... • Quantifying TIM benefits will advance program continuity: • Builds critical mass for program support from managers and elected officials: • Supporting what works • Ensures buy-in from diverse stakeholders: • Multiple agencies, coordinated response
The Freeway and Arterial System of Transportation The Freeway and Arterial System of Transportation (FAST) is one of the first truly integrated Intelligent Transportation System (ITS) organizations in the country. FAST is one part of the bigger TIM picture – getting the lanes opened quicker to improve the public’s commute throughout Southern Nevada.
Common Critical Needs Graph 1 shows the minutes required to clear travel lanes and the weekly totals for each category from August 27, 2011 back to January 2, 2011. NDOT bundles this information into the following categories: 0 to 15 minutes, 15 to 30 minutes, 30 to 45 minutes, 45 to 60 minutes, and greater than 60 minutes. quick incident clearance
Common Critical Needs Graph 2 shows the amount of congestion caused by the crashes. Congestion severity is assigned to the following categories which measure how much delay is added to the baseline travel time: The baseline is either the free flow travel time or the recurring congestion travel time for the corridor where the crash occurs. (less than 3 minutes of additional travel time) (5 to 10 minutes of additional travel time) (3 to 5 minutes of additional travel time) quick incident clearance (greater than 10 minutes)
Common Critical Needs Graph 3 shows the average time to clear the lane(s) for crashes managed by the FAST system. quick incident clearance The overall average in this time period is just under 40 minutes.
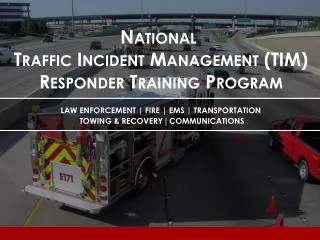
National Traffic Incident Management Responder Training The emphasis of Tier 1 training is response activities and thus targets incident responders.
National Traffic Incident Management Responder Course Audience: Objectives of Program: • Quick Clearance • Improved responder safety • Improved reliability • Improved motorist safety Approach: • Core competencies • All disciplines participated every step • Development of multi-disciplinary training program for all responder stakeholders • Cross-training in TIM core competencies • Law Enforcement officers • Fire and Rescue personnel • Transportation Professionals • Public works • Emergency medical services • Towing and recovery • Hazmat responders • Coroners/medical examiner
In-Person Delivery Train the Trainer: Multi-disciplinefull curriculum developed in SHRP2 L12 project. Classroom Training: Multi-discipline trainers trained through the TtT courses will conduct classroom-based training. Bringing the Training to Nevada please contact: Paul Jodoin, TIM Program Manager FHWA Office of Operations (202) 366-5465 Paul.Jodoin@dot.gov
Questions/Comments Ray Murphy, FHWA Office of Technical Services ray.murphy@dot.gov http://www.ops.fhwa.dot.gov/publications/fhwahop10050x/fhwahop10050x.pdf FHWA Technical Assistance Program that provides public sector transportation stakeholders to tap into the growing TIM knowledge base. http://www.ops.fhwa.dot.gov/eto_tim_pse/p2p/index.htm