Download
1 / 10
100 likes | 106 Vues
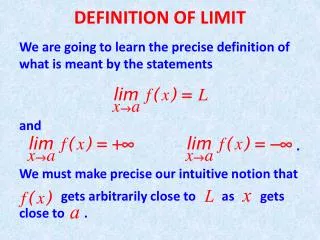
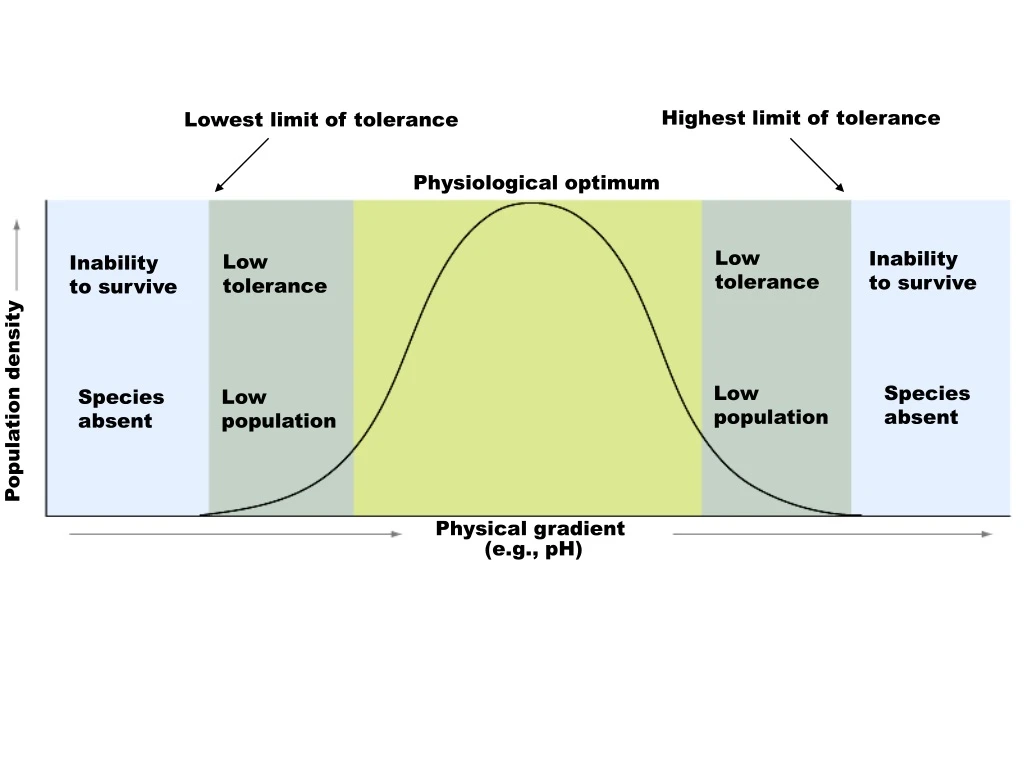
Highest limit of tolerance. Lowest limit of tolerance. Physiological optimum. Low tolerance. Inability to survive. Low tolerance. Inability to survive. Low population. Species absent. Species absent. Low population. Population density. Physical gradient (e.g., pH). 380.

E N D
Highest limit of tolerance Lowest limit of tolerance Physiological optimum Low tolerance Inability to survive Low tolerance Inability to survive Low population Species absent Species absent Low population Population density Physical gradient (e.g., pH)
380 360 Carbon dioxide concentration (ppm) 340 320 Mauna Loa Observatory, Hawaii
75° 75° 14 60° 60° 15 6 45° 45° 16 7 17 30° 30° 13 5 15° 12 15° 5 11 4 Latitude 18 Equator 0° 10 0° 4 3 3 15° 15° 9 20 19 30° 30° 21 2 8 45° 45° 1 60° 60°
Cold dry air falls Polar cell Moist air rises – rain Polar cap Arctic tundra Polar front Ferrell cell Evergreen coniferous forest Midlatitude westerlies Temperate deciduous forest and grassland Desert Horse latitudes Subtropical high pressure belt Northeast trades Tropical deciduous forest Doldrums ITCZ Hadley cell Equator Tropical rain forest 0 Southeast trades Tropical deciduous forest Horse latitudes 30 Subtropical high pressure belt Desert Midlatitude westerlies Temperate deciduous forest and grassland 60 Polar front Polar cap Moist air rise – rain Cold dry air falls Polar cell
40 Clouds and rainfall keep temperature uniform across the tropics 30 20 10 Mean annual temperature °C 0 -10 -20 20 50 0 10 30 40 60 70 80 Degrees latitude
25 20 2 15 Number of buffalo per km 10 5 500 1500 1000 2000 Rainfall (mm)
10 20 0 0 30 10 40 40 40 30 60 30 80 100 30 140 120 20 160 180
(1) (2) Species abundance (3) (4) Environmental gradient
0.4 0.2 0.0 Change from 1940 temperature (°C) -0.2 -0.4 -0.6 1870 1890 1910 1930 1950 1970 1990 Year