Download
1 / 68
680 likes | 695 Vues
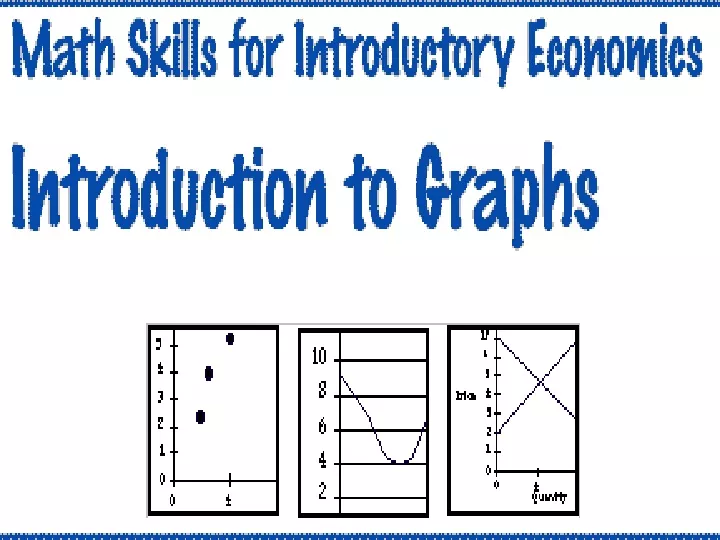
Illustrating Complex Relationships. In economics you will often see a complex set of relations represented graphically. You will use graphs to make interpretations about what is happening as variables in a relationship change. Changes in the supply of corn.

E N D
Illustrating Complex Relationships • In economics you will often see a complex set of relations represented graphically. • You will use graphs to make interpretations about what is happening as variables in a relationship change.
A change in one or more of the determinants of supply will cause a change in supply. • An increase in supply shifts the supply curve to the right as from S1 to S2. • A decrease in supply is shown graphically as a shift of the curve to the left, as from S1 to S3.
A change in the quantity supplied is caused by a change in the price of the product as is shown by a movement from one point to another--as from a to b--on a fixed supply curve.
The market equilibrium price and quantity comes at the intersection of supply and demand curves. • At a price of $3 at point C, firms willingly supply what consumers willingly demand.
When price is too low (say $2), quantity demanded exceeds quantity supplied, shortages occur, and prices are driven up to equilibrium. • What occurs at a price of $4?
The skills you will learn in this book are to: • Describe how changing the y-intercept of a line affects the graph of a line. • Describe how changing the slope of a line affects the graph of a line. • Describe what has happened to an equation after a line on a graph has shifted.
Identify the intersection of two lines on a graph. • Describe what happens to the x and y coordinate values of intersecting lines after a shift in a line on the graph. • Identify the Point of Tangency on a curve.
Determine whether a line is a tangent line. • Calculate the slope at a point on a curve. • Determine whether the slope at a point on a curve is positive, negative, zero, or infinity.
Identify maximum and minimum points on a curve. • Determine whether a curve does or does not have maximum and minimum points.
Analyzing Lines on a Graph • After reviewing this section you will be able to: • Describe how changing the y-intercept of a line affects the graph of a line. • Describe how changing the slope of a line affects the graph of a line. • Describe what has happened to an equation after a line on a graph has shifted.
The slope is used to tell us how much one variable (y) changes in relation to the change in another variable (x).
The constant labeled "a" in the equation is the y-intercept. • The y-intercept is the point at which the line crosses the y-axis.
Comparing Lines on a Graph • By looking at this graph, we can see that the cost of our plain pizza is $7.00, and the cost per topping is our slope, 75 cents. • This line has the equation of y = 7.00 + .75x.
Shift Due to Change in y-intercept • In the graph at the right, line P shifts from its initial position P0 to P1. • Only the y-intercept has changed. • The equation for P0 is y = 7.00 + .75x, and the equation for P1 is y = 8.00 + .75x.
Shift Due to Change in Slope • In the graph at the right, line P shifts from its initial position P0 to P1. • Line P1 is steeper than the line P0. This means that the slope of the equation has gone up. • The equation for P0 is y = 7.00 + .75x, and the equation for P1 is y = 7.00 + .x.
Identifying the Intersection of Lines • After reviewing this section you will be able to: • Identify the intersection of two lines on a graph. • Describe what happens to the x and y coordinate values of intersecting lines after a shift in a line on the graph.
Intersection of Two Lines • Many times in the study of economics we have the situation where there is more than one relationship between the x and y variables. • You'll find this type of occurrence often in your study of supply and demand.
In this graph, there are two relationships between the x and y variables; one represented by the straight line AC and the other by straight line WZ.
In one case, the two lines have the same (x, y) values simultaneously. • This is where the two lines RT and JK intersect or cross. • The intersection occurs at point E, which has the coordinates (2, 4).
Examining The Shift of a Line • In any situation where you are given a shift in a line: • identify both the initial and final points of intersection, then • compare the coordinates of the two.
Before the Shift • This graph contains the two lines R and S, which intersect at point A (2, 3). • Lines shifts to the right. • What happens to the intersection of the two lines if one of the lines shifts?
After the Shift • On the graph below, line S0 is our original line S. • Lines S1 represents our new S after it has shifted. • The new point of intersection between R and S is now point B (3, 4).
Example • Compare the points A (2, 3) and B (3, 4) on this graph. • The x-coordinate changed from 2 to 3. • The y-coordinate changed from 3 to 4.
Nonlinear Relationships • After reviewing this unit, you will be able to: • Identify the Point of Tangency on a curve. • Determine whether a line is a tangent line. • Calculate the slope at a point on a curve. • Determine whether the slope at a point on a curve is positive, negative, zero, or infinity.
Identify maximum and minimum points on a curve • Determine whether a curve does or does not have maximum and minimum points.
Introduction • Most relationships in economics are, unfortunately, not linear. • Each unit change in the x variable will not always bring about the same change in the y variable. • The graph of this relationship will be a curve instead of a straight line.
This graph below shows a nonlinear relationship between x and y.
Determining the Slope of a Curve • One of the differences between the slope of a straight line and the slope of a curve is that: • the slope of a straight line is constant, • while the slope of a curve changes from point to point.
To find the slope of a line you need to: • Identify two points on the line. • Select one to be (x1, y1) and the other to be (x2, y2). • Use the equation:
The slope of the curve changes as you move along it. • For this reason, we measure the slope of a curve at just one point. • For example, instead of measuring the slope as the change between any two points, we measure the slope of the curve at a single point (at A or C).
Tangent Line • A tangent is a straight line that touches a curve at a single point and does not cross through it. • The point where the curve and the tangent meet is called the point of tangency. • Both of the figures below show a tangent line to the curve.
This curve has a tangent line to the curve with point A being the point of tangency. • In this case, the slope of the tangent line is positive.
This curve has a tangent line to the curve with point A being the point of tangency. • In this case, the slope of the tangent line is negative.
The line on this graph crosses the curve in two places. • This line is not tangent to the curve.
The slope of a curve at a point is equal to the slope of the straight line that is tangent to the curve at that point.
Example • What is the slope of the curve at point A?
The slope of the curve at point A is equal to the slope of the straight line BC. • By finding the slope of the straight line BC, we have found the slope of the curve at point A. • The slope at point A is 1/2, or .5. • This is the slope of the curve only at point A.
Slope of a Curve: Positive, Negative, or Zero? • If the line is sloping up to the right, the slope is positive (+).
If the line is sloping down to the right, the slope is negative (-).