Download
1 / 157
1.57k likes | 1.57k Vues
Learn about the process that contributes the most to the formation of coal, which is the layering of sediments and partially decayed plant matter. This resource also explains the difference between nonrenewable and renewable resources.

E N D
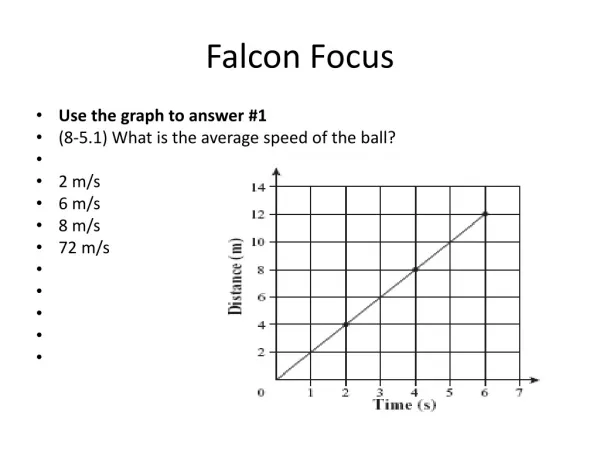
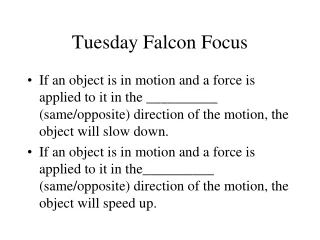
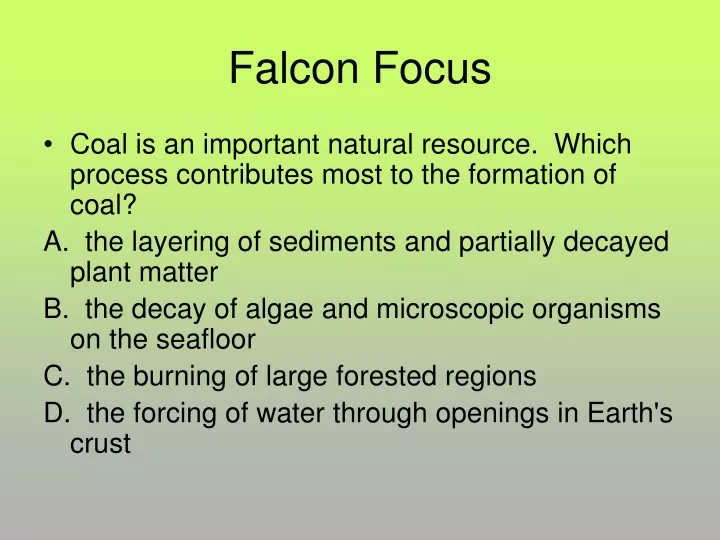
Falcon Focus • Coal is an important natural resource. Which process contributes most to the formation of coal? A. the layering of sediments and partially decayed plant matter B. the decay of algae and microscopic organisms on the seafloor C. the burning of large forested regions D. the forcing of water through openings in Earth's crust
Essential Question • Explain the difference between nonrenewable and renewable resources.
Standard 8-3.9: Identify and illustrate geologic features of South Carolina and other regions of the world through imagery (including aerial photography and satellite imagery) and topographic maps http://www.blinkx.com/watch-video/topographic-maps-video-notes/gRImv_NDcFHH8darefbjXw
Introduction to Imagery and Topographic Maps Introduction • Geologic features on Earth can be identified through use of aerial photographs, satellite imagery and topographic maps. 3 Table of Contents
Whether it is on paper or on a computer screen, a map is the best tool available to record and view the arrangement of things on the Earth's surface. Maps of various kinds—road maps, political maps, land use maps, maps of the world—serve many different purposes.
Imagery Maps • Highflying aircraft and satellites high above Earth use sensors and cameras to gather information about Earth’s landforms and resources. • Computer models translate the satellite data into images and scientists can identify features on the Earth’s surface through colors and shapes that features make on the image.
Types of Imagery • . • Electronic scanning images: This method records selected parts of the electromagnetic spectrum. A common example is SLAR (side looking airborne radar), where a radar beam is sent to the ground at a perpendicular angle, which then reflects off the surface, and is recorded by a scanner on the aircraft. SLAR of Puerto Rico, USGS image 4 Table of Contents
Types of Imagery • . Aerial Photograph images:These photos have been available since the early 1930’s, though this method has largely been replaced by satellite imagery. Most photographs were taken by a camera shooting straight down (vertical photographs) from airplanes and because they have low distortion, they were useful for extracting data. Oblique aerial photos are good for illustrations, but are distorted. Typically, one views a set of overlapping aerial photographs with a stereoscope to see it in 3-dimension. Aerial photography was first practiced by the French photographer and balloonist Nadar in 1858 over Paris, France. Football stadium, NY. USGS image. 4 Table of Contents
Types of Imagery • Satellite Images: Most common method currently for identifying land features. Black & white, infrared black & white, natural color, infrared color, and various combinations exist in satellite imagery. Colors recorded by color infrared film are not true colors, but false colors. This is because they cut out all or part of the visible spectrum. In false colors, green plants are red and clear water is black. Honolulu, HI. USGS image 4 Table of Contents
Using imagery to show changes on Earth’s surface • The most valuable imagery for geologists was gathered by the LANDSAT satellites launched from 1972 to 1984. All carried multispectral scanners capable of scanning 185-km wide paths in 4 separate wavelength bands corresponding to green, red, and 2 reflected infrared bands. • False colors are obtained by projecting the four wavelength bands through filters and combining them to form a false-color composite image. • Geologic and geographic features can be recognized as well natural events such as floods and fires. Greece before and after fires of 2007 (NASA image). Notice the red areas in the photo on the right indicating soil exposure where there was once vegetation. Before After 5 Table of Contents
Images from satellites can provide us with changes of the land surface over time. For example, the outlet glacier in Iceland (photo right). The true-color Landsat 7 image to the right shows how much the glacier terminus has moved back in 18 years. The image was taken in 2000, where one can see even more retreat since 1991 (NASA image). Entire cities can be monitored for wide spread changes. There were noticeable land-mark changes to the New York City landscape after September 11, 2001. To the left is an image of Baghdad, where land surface changes have occurred over recent years (NASA image). Table of Contents
South Carolina is an interesting state because there are a variety of landscape that can be easily identified on many types of maps including mountains and streams of the Piedmont Region and Carolina Bays and swamplands of the Coastal Region. In addition, 1. coastal features, 2. forested areas, 3. farmlands, 4. tributaries, and 5. lakes can be observed on imagery maps. Forest (lush green) Farmland (red/green patchwork) Swampland and estuaries Lakes (light blue to black depending on sediment load) Satellite image of South Carolina. All images used with permission of geology.com 7 Table of Contents
Carolina Bays are an interesting surface feature located along the Atlantic seaboard. They are elliptical depressions numbering approximately 500,000 clustered in groups from Florida to New Jersey and are usually oriented NW-SE. • Most of these bays are marshy wetlands. Some of the larger ones are lakes and they vary in size from one to several thousand acres. A cluster several of bays filled with vegetation (wikipedia image, public domain) • Radiocarbon and palynology (pollen) dating techniques indicate that the bays are of Pleistocene age. • Bays can be seen clearly on topographic and imagery maps. • No one theory for origin has been confirmed, and theories include sea currents, upwelling of groundwater, and climate change. Scientists have found that the orientation is consistent with wind patterns during the last glaciation. Elliptical Carolina bays of N.C. clearly seen on digital elevation image (wikipedia image, public domain) 8 Table of Contents
Other land surface features of the world can be seen by studying imagery Alaskan glaciers, usually as light blue (geology.com image) Folded mountains of the Appalachians, Penn. (geology.com image) Volcanoes, Wash. (geology.com image) Drumlin field, Wayne County N.Y. (USGS image) Finger Lakes, N.Y. (geology.com image) 9 Mt. St. Helens (eruption 1980) (NASA image) Table of Contents
Geologic features (for example, mountains, river and tributary flow, lakes, farmland, forests, Carolina bays, or coastal features) can be identified using South Carolina satellite images and aerial photographs, as well as other imagery from regions of the world.
Topograhic Maps • These are maps that use symbols to portray the land as if viewed from above. • They provide information on elevation, relief, and slope of the ground surface, as well as the location of roads, buildings, swamps, and other features, natural and man-made. • Along with the scale and symbols, the contour lines and the contour interval are critical to understanding the topographic map.
Topographic Maps • Geologic features can be identified on a topographic map using the contour lines and interval spacing as well as the symbols on the map. • Geologic features can also be illustrated the geologic feature with a two or three-dimensional model or profile based on the topographic data.
Topographic Maps: • Understanding the scale of a map, the symbols used and contour intervals and lines is important. The scale of a map is the relationship between a distance on a map and the corresponding distance on the earth's surface • Cross-sectional profiles can be easily made using a topographic map, which is helpful when determining the slope of the area.
One of the most widely used of all maps is the topographic map. The feature that most distinguishes topographic maps from maps of other types is the use of contour lines to portray the shape and elevation of the land. • The Breakdown: • Topographic Maps = contour lines = elevation
Topographic maps usually portray both natural and manmade features. They show and name works of nature including mountains, valleys, plains, lakes, rivers, and vegetation. They also identify the principal works of man, such as roads, boundaries, transmission lines, and major buildings.
The wide range of information provided by topographic maps make them extremely useful to professional and recreational map users alike. Topographic maps are used for engineering, energy exploration, natural resource conservation, environmental management, public works design, commercial and residential planning, and outdoor activities like hiking, camping, and fishing.
What are contour lines? • Contour lines are lines that connect points that are of the same elevation. • They show the exact elevation, the shape of the land, and the steepness of the land’s slope. • Contour lines never touch or cross.
Other Topographic Terms • Map scale – compares distances on the map with distances on earth. • Legend– explains symbols used on the map. • Index contours – contour lines that are labeled to help you find the contour interval.
What is a contour interval? • A contour interval is the difference in elevation between two contour lines that are side by side. • Remember that a contour interval is not the distance between the two lines – to get the distance you need to use the map scale.
What if my contour lines are close together? • If the contour lines are close together, then that indicates that area has a steep slope.
What if my contour lines are far apart? • If the contour lines are far apart, then that indicates the land has a gentle slope (low slope).
What do the dark colored contour lines mean? • The dark colored contour lines represent every fifth contour line to make it easier to read the map.
What do the colors on the topographic map represent? • Blue lines/shapes - represent water features, such as streams and lakes. • Brown – contour lines • Black – Roads, buildings, railroads, other man made objects. • Green – Woodland areas • Red - Highways
Let’s keep going! 100m
Now we’re at 200m. 200m 100m
Shall we march on? 200m 100m
We’ve made it to 300m! 300m 200m 100m
On to the peak! 300m 200m 100m
We’re on the peak, but what’s our elevation? 300m 200m 100m
Any ideas? Let’sadd contour lines for every 50 meters and see if that helps. 300m 200m 100m
We know that we are above 350m, but less than 400m. 350m 300m 250m 200m 150m 100m 50m
Let’s head down the hill, it’s getting late! 350m 300m 250m 200m 150m 100m 50m
Now what’s our elevation? If you said somewhere between 200m and 250m you are right! 350m 300m 250m 200m 150m 100m 50m
Let’s try this again! 350m 300m 250m 200m 150m 100m 50m
What’s our elevation now? If you said 50m or just under, you’re right! 350m 300m 250m 200m 150m 100m 50m
Let’s now look at the same hill, but the way we might see it from an airplane!
If you said more than 150 meters, but less than 200 meters your right!