Download
1 / 14
140 likes | 264 Vues
Variability in Corn Response to N Fertilizer along a 1000-ft Hillslope. John Schmidt Nan Hong Adam Dellinger Doug Beegle Henry Lin ARS Missouri Penn State. Background. Improving N recommendations for corn Spatial variability in relief, aspect, soil water content

E N D
Variability in Corn Response to N Fertilizer along a 1000-ft Hillslope John Schmidt Nan Hong Adam Dellinger Doug Beegle Henry Lin ARS Missouri Penn State
Background Improving N recommendations for corn Spatial variability in relief, aspect, soil water content Fox observed a relationship in PA between EONR and July precipitation
Field site - 2005 1000 ft horizontal, 30 ft vertical relief Previous crop soybean Soil pH: 5.3 – 5.7 Soil P (M3): 24 – 77 Soil K (M3): 97 – 156
Treatment design Ten locations, 2 blocks each Six N treatments: 0, 50, 100, 150, 200, 250 lb N / acre, applied at planting as NH4NO3 TDR access tubes at each location Soil water content, 5 June – 2 Sept, 0 – 90 cm depth Canopy reflectance, Crop Circle ACS-210 Grain yield at harvest
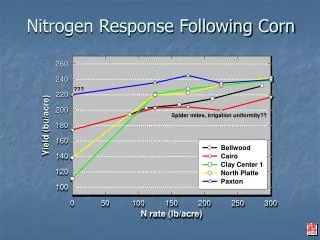
Summary EONR increased linearly with an increase in soil profile water content, 25 July – 30 June EONR was not correlated to NDVI ratio NDVI 01 July decreased linearly with increasing soil profile water content on 30 June