Download
1 / 17
170 likes | 292 Vues
Congestion Mitigation. Michael Cassidy Anthony D. Patire. Expressway traffic management. Main Themes Innovative control strategies Equitable approach Ameliorate capacity drop. Capacity Drop. Queue. Discharge Drop. Cumulative Vehicle Count. A(t ). m. 0.9m. Added Delay. D(t ). Time.

E N D
Congestion Mitigation Michael Cassidy Anthony D. Patire
Expressway traffic management • Main Themes • Innovative control strategies • Equitable approach • Ameliorate capacity drop
Capacity Drop Queue Discharge Drop Cumulative Vehicle Count A(t) m 0.9m Added Delay D(t) Time
Move queue to ramp Change in Discharge? Meter Conventional Strategies • Traffic Signals • Restrict flow onto freeway • Add queues to city streets • On-ramp metering • Long queue spillover • Inequitable transfer of delay
Sustainability Context • Problem: Congestion will never really “go away” • Goal: Efficient management of existing resources • Save time and gasoline • Equitable solutions • Method: Understand mechanism of capacity drop and reverse it to maintain high discharge flow
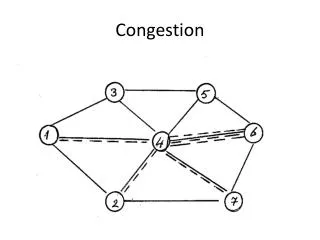
Earlier Work X1 • Capacity Drop Mechanism at an Isolated Merge Bottleneck • Started with a sharp rise in shoulder lane accumulation X1 X3 • Induced drivers to maneuver into adjacent freeway lanes (lane changing rates doubled) X3 -- Rudjanakanoknad and Cassidy, UC Berkeley
Variable Message Signs & Variable Speed Limits New bN cap = B>A bN cap = A • Higher Outflow • Reduction in “disruptive” lane changes • Many Open Questions • Requires a “full accounting” VMS: “Onramp Congestion Ahead” Meter
Camera Loop VMS Yokohama-Machida Bottleneck Camera 13 22.73KP Camera 3 21.57KP +2.38% -1.87% -0.52% -0.23% Traffic Direction 21KP 23KP 22KP 20KP
Manual Counts Dec 23,2005 On this day 12 & 13 mostly superimposed
Key Features of Bottleneck • Scattered braking at camera 13 • Excess accumulation not sustained • Excess accumulation between cam 11 & 12 • Coincident with flow drops • But the head-of-queue moves upstream • Cumulative curves for cameras 12 and 13 mostly superimposed • Waves appear to be forward moving • Freeflow speed-drop on uphill segment
Speculation On the grade, freeflow velocity may be a function of flow Flow [veh/hr] Triangular Fundamental Diagram Fundamental Diagram on the grade Velocity Density [veh/km]
Freeflow-Speed Adjusted Counts 4700 Slopes in vehicles per hour 5100
Freeflow-Speed Adjusted Counts 4700 Slopes in vehicles per hour 5100
Final Thoughts • Freeway is not homogeneous due to the upward grade • On the grade, freeflow speed diminishes with flow • Conditions not FIFO • Queue begins in rightmost lane • We are optimistic that we can study the mechanism even if it happens at camera 13
Future Work • Analyze more data on different days • Top-of-hill vs. Bottom-of-hill • Data after 7am • Understand capacity drop mechanism • Disaggregate lanes • Measure density profile • Invent and field-test capacity-drop mitigation schemes