1 / 6

Fig. 17-11 The net work done by the system in the process aba is –500 J.

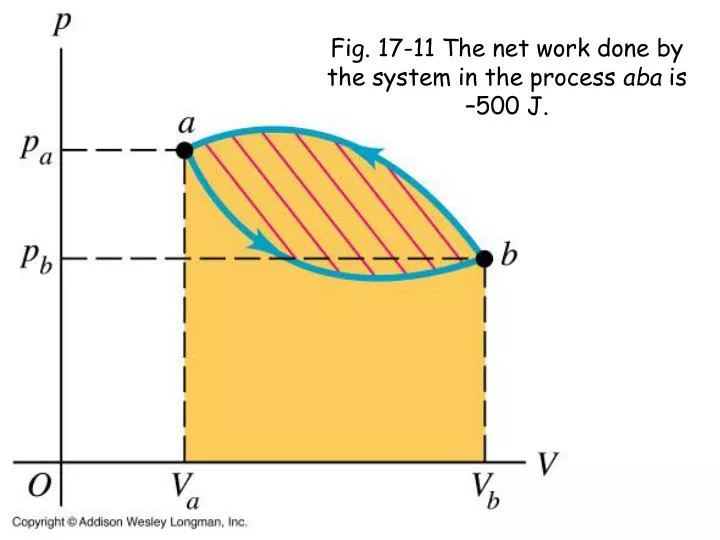
Fig. 17-11 The net work done by the system in the process aba is –500 J. Fig. 17-12 A p-V diagram (Example 17-4).

juana
Télécharger la présentation

Fig. 17-11 The net work done by the system in the process aba is –500 J.

An Image/Link below is provided (as is) to download presentation Download Policy: Content on the Website is provided to you AS IS for your information and personal use and may not be sold / licensed / shared on other websites without getting consent from its author. Content is provided to you AS IS for your information and personal use only. Download presentation by click this link. While downloading, if for some reason you are not able to download a presentation, the publisher may have deleted the file from their server. During download, if you can't get a presentation, the file might be deleted by the publisher.

E N D

Presentation Transcript


  1. Fig. 17-11 The net work done by the system in the process aba is –500 J.

  2. Fig. 17-12 A p-V diagram (Example 17-4)

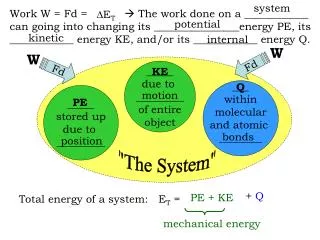
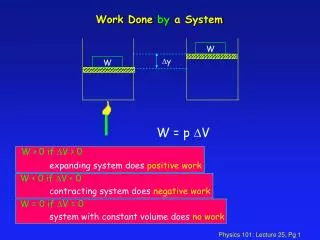
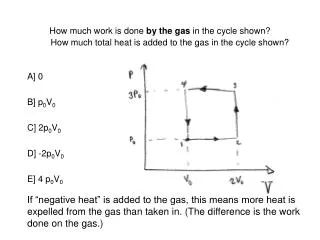
  3. KINDS OF THERMODYNAMIC PROCESSESADIABATIC – NO HEAT TRANSFER; Q = 0; DU = -WISOCHORIC – CONSTANT VOLUME; DU = Q ISOBARIC – CONSTANT PRESSURE; W = p (V2 – V1)ISOTHERMAL – CONSTANT TEMPERATURE; only for ideal gas DU = 0, Q = W The First Law of Thermodynamics Q = DU + W or DU = Q - W

  4. Fig. 17-13 Processes for an ideal gas:adiabatic Q=0isochoric W=0isothermal DU=0

  5. Fig. 17-14 The internal energy of an ideal gas depends only on its temperature, not on its pressure of volume.

  6. Fig. 17-15 Raising the temperature of an ideal gas by various processes Q = DU + W and DU= f(T)Isochoric W=0 so Q=DUIsobaric Q = DU + p(V2-V1)

More Related