Download
1 / 25
250 likes | 356 Vues
An Investigation of the INTERPRET Spectra using Automated Pattern Recognition Techniques. Rosemary Tate St George’s Hospital Medical School,. Questions. 1. Can the most common types of tumour be distinguished using single voxel spectroscopy?

E N D
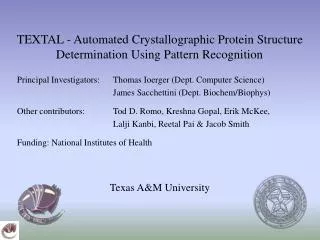
An Investigation of the INTERPRET Spectra using Automated Pattern Recognition Techniques Rosemary Tate St George’s Hospital Medical School,
Questions 1. Can the most common types of tumour be distinguished using single voxel spectroscopy? 2. If so, which spectral features provide the best discrimination? 3. Do these features generalise across centres? 4. Can spectra from different centres be combined?
Data St George's Hospital, London 35 patients • 13 glioblastomas, • 6 grade II astrocytomas • 4 grade III astrocytomas, • 5 meningiomas, • 7 metastases STEAM 30 GE PROBE 2048 pts SW 2500 IDI Bellvitge, Barcelona 77 patients • 24 glioblastomas, • 11 grade II • 14 grade III astrocytomas, • 13 meningiomas, • 20 metastases PRESS 30 Philips 512 pts SW 1000
Automated Spectral processing • Frequency modulation correction, • water resonance filtering • chemical shift scale adjustment • line broadening 0.8 Hz • Fourier transformation • Zero water region • magnitude spectrum • Interpolate to same resolution • select intensities between 6 - -2 ppm • normalise vector to unit length
Pattern Recognition Analysis • Correlation analysis for feature selection • Principal component analysis • Linear discriminant analysis - with leave one out for testing.
Answers 1. Can the most common types of tumour be distinguished? 3 groups benign (meningiomas) low grade aggressive (metastases and glioblastomas) 3 groups discriminant analysis ~98% correctly classified
3 group discrimination: aggressive/low grade/benign gbm met mn astII d s c o r e 1 dscore 2 Discriminant scores for 3 groups “aggressive’’(metastasis (met) glioblastoma (gbm)), meningiomas (mn) and low grade(astII)
Answers 1. Distinguishing between tumours GradingAstrocytomas astII and astIII vs. glioblastomas ~ 90%, distinguishing between the 3 grades ~75%
d s c o r e 1 astII astIII gbm dscore 2 Discriminant scores for the three grades of astrocytomas
Answers • Which spectral features provide good discrimination? • Combination of selected spectral intensities or • Principal Components calculated from the whole spectrum • Do features generalise? • Yes, most of them
astII mn gbm * IDI SGH glutamine g lipid Spectral intensities representing lipid and glutamine(+)
* IDI SGH myoinos I to l astII astIII gbm lipid Values of pts from lipid and myoinostol region for astrocytic tumours.
Answers Can spectra from different centres be combined for classification? Looks promising
astII gbm met mn astIII 2 P C 2 PC 1 1st 2 Principal Components of the IDI spectra
astII astII gbm met mn P C 2 PC1 1st 2 Principal Components of the SGH spectra weights calculated using the IDI spectra
* IDI SGH astII astII gbm P C 2 met mn PC 1
astII astII 2nd and 3rd Principal Components of the IDI spectra for astrocytoma grade II and III.
astII astII * IDI SGH 1st 2 Principal Components of the IDI and SGH spectra weights calculated using the IDI spectra
Conclusions 1. Magnitude spectra give good results. 2. PCA gives excellent data compression for these groups of short-echo spectra 3. Individual intensity values give good separation between groups. 4. Most features generalise across centres.
Next Questions to be answered 1. What type of normalisation should we use? 2. What to do about uncommon groups? 3. Mets vs.. GBMs? 4. What other information can we use - e.g image and clinical information? 5.Measures of confidence? 6. Quality control.
Example spectra - glioblastoma and meningioma. Normalised using unsuppressed water
Bottlenecks Lack of test data Problems with processing - e.g phasing Software for the GUI
Acknowledgements SGHMS John Griffiths, Franklyn Howe, Christophe Ladroue, Alison Loosemore, Mary Murphy, Tony Bell, Peter Wilkins, Sarah Barton UOS Joshua Underwood, Dionisio Acosta, Rose Luckin, Des Watson Barcelona Carles Arus, Margarida Julia, Mohamed Zakari, Antoni Capdevila, Carles Majos