Download
1 / 138
1.4k likes | 1.58k Vues
Methamphetamine: New Knowledge and Effective Treatment Approaches. Thomas Freese, PhD Beth Rutkowski, MPH. Pacific Southwest Addiction Technology Transfer Center UCLA Integrated Substance Abuse Programs SASA Spring Forum May 11, 2006. Forms of Methamphetamine. Methamphetamine Powder

E N D
Methamphetamine: New Knowledge and Effective Treatment Approaches Thomas Freese, PhD Beth Rutkowski, MPH Pacific Southwest Addiction Technology Transfer Center UCLA Integrated Substance Abuse Programs SASA Spring Forum May 11, 2006
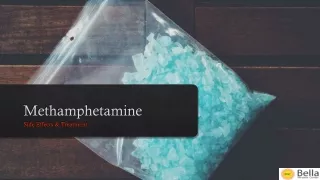
Forms of Methamphetamine Methamphetamine Powder Users’ Description: Beige/yellowy/off-white powder Base / Paste Methamphetamine Users’ Description: ‘Oily’, ‘gunky’, ‘gluggy’ gel, moist, waxy Crystalline Methamphetamine Users’ Description: White/clear crystals/rocks; ‘crushed glass’ / ‘rock salt’
Prevalence Estimates: Adolescents • Among high school seniors surveyed in 2005, 4.5% had tried meth in their lifetime (down from 8.2% in 1999). • Lifetime use among 8th and 10th graders was 3.1% and 4.1%, respectively. • Also during 2005, 2.5% of high school seniors had used meth in the last year and 0.9% had used it in the last month. SOURCE: NIDA, Monitoring the Future Study: Overview of Key Findings, 2006.
Trends in Methamphetamine Use and Initiation • In 2004, an estimated 12 million persons (4.9 percent of persons aged 12 or older) had used methamphetamine at least once in their lifetime, 1.4 million (0.6 percent) had used it in the past year, and 600,000 (0.2 percent) had used it in the past month. • Between 2002 and 2004, the number of recent methamphetamine initiates remained level at around 300,000 per year. The average age at first use among new users was 18.9 years in 2002, 20.4 years in 2003, and 22.1 years in 2004. SOURCE: National Survey on Drug Use and Health, SAMHSA, 2005.
Meth Use in Past Month among Persons Aged 12 or Older, by Dependence and Abuse: 2002, 2003, and 2004 SOURCE: National Survey on Drug Use and Health, SAMHSA, 2005.
Methamphetamine Use in Past Year among Persons Aged 12 or Older, by State: 2002, 2003, and 2004 SOURCE: National Survey on Drug Use and Health, SAMHSA, 2005.
Rate (per 100,000) of Amphetamine/Meth ED Visits: 1995 vs. 2002 *denotes a statistically significant increase SOURCE: Office of Applied Studies, SAMHSA, Drug Abuse Warning Network, 2002.
Percent of Male Arrestees Testing Positive for Methamphetamine: 1999 vs. 2003 SOURCE: National Institute on Justice, Arrestee Drug Abuse Monitoring Program, 2003.
Percent of Arrestees Testing Positive for Meth, by Gender: 2003 SOURCE: National Institute on Justice, Arrestee Drug Abuse Monitoring Program, 2003.
> 58 35 - 58 12 - 35 < 12 No data Primary Amphetamine/Methamphetamine TEDS Admission Rates: 1992(per 100,000 aged 12 and over) SOURCE: 2002 SAMHSA Treatment Episode Data Set (TEDS).
> 58 35 - 58 12 - 35 < 12 No data Primary Amphetamine/Methamphetamine TEDS Admission Rates: 1997(per 100,000 aged 12 and over) < 12 SOURCE: 1997 SAMHSA Treatment Episode Data Set (TEDS).
< 12 35 -58 200 or more 150-199 100-149 12 - 35 58-99 Primary Amphetamine/Methamphetamine TEDS Admission Rates: 2002(per 100,000 aged 12 and over) SOURCE: 2002 SAMHSA Treatment Episode Data Set (TEDS).
< 12 35 -58 200 or more 150-199 100-149 12 - 35 58-99 Primary Amphetamine/Methamphetamine TEDS Admission Rates: 2003(per 100,000 aged 12 and over) SOURCE: 2003 SAMHSA Treatment Episode Data Set (TEDS).
CA Methamphetamine Treatment Admissions, by Route of Administration: 2000-June 2005 SOURCE: CADDS, CA Department of Alcohol and Drug Programs, 2005.
IHS-Wide RPMS PCC Outpatient Encounters for Amphetamine Related Visit by Calendar Year 1997 1998 1999 2000 2001 2002 2003 2004
Trends in LA County Treatment Admissions by Primary Substance of Abuse SOURCE: ADP, California Alcohol and Drug Data System, 2005.
Clandestine Lab Incidents: 2000 944 2 28 34 123 0 1 351 26 127 0 7 2 0 21 12 8 1 283 0 36 29 0 363 1 283 127 209 3 142 1 641 889 104 2,198 14 249 399 384 243 4 50 <100 54 126 26 84 100-499 429 15 500-999 5 15 >1000 Source: national Clandestine Laboratory Database (http://www.dea.gov/concern/map_lab_seizures.html)
Clandestine Lab Incidents: 2001 1,480 2 65 85 154 0 2 587 45 131 1 18 8 1 122 30 17 1 578 1 208 89 2 521 0 259 319 162 17 240 5 852 2,180 175 1,883 32 495 806 312 404 10 103 <100 59 224 14 166 100-499 619 16 500-999 3 35 >1000 Source: national Clandestine Laboratory Database (http://www.dea.gov/concern/map_lab_seizures.html)
Clandestine Lab Incidents: 2002 1,443 0 89 207 250 0 1 525 79 119 0 34 26 1 225 61 30 2 861 3 357 97 1 723 0 105 552 121 52 450 10 769 2,767 373 1,743 47 608 883 253 431 36 121 <100 127 462 33 264 100-499 547 133 500-999 10 157 >1000 Source: national Clandestine Laboratory Database (http://www.dea.gov/concern/map_lab_seizures.html)
Clandestine Lab Incidents: 2003 1,011 0 73 252 309 0 1 419 101 91 1 40 18 1 267 26 62 1 1,272 0 253 124 2 979 2 131 751 85 75 352 30 641 2,885 485 1,287 168 953 1,068 140 776 65 195 <100 250 319 40 341 100-499 677 94 500-999 3 240 >1000 Source: national Clandestine Laboratory Database (http://www.dea.gov/concern/map_lab_seizures.html)
Clandestine Lab Incidents: 2004 947 3 65 234 168 2 1 472 78 42 1 31 48 0 295 21 106 0 1,335 0 205 1074 286 1 3 79 1,058 72 165 228 75 584 2,788 571 764 318 1,327 659 122 800 170 120 <100 261 267 66 285 100-499 452 123 500-999 20 276 >1000 Source: national Clandestine Laboratory Database (http://www.dea.gov/concern/map_lab_seizures.html)
County-Level Rankings of Meth Lab Seizures: 1H 2005 – Top 10 SOURCE: LA CLEAR, 2005 (as of 6/23/05).
Methamphetamine: A Growing Menace in Rural America • In 1998, rural areas nationwide reported 949 methamphetamine labs. • Last year, 9,385 were reported. • This year, 4,589 rural labs had been reported as of July 26. • Source: El Paso Intelligence Center (EPIC), U.S. DEA
Lab Seizure Locations • Most common meth lab facilities were single-family houses, followed by apartments, mobile homes, vehicles in traffic stops, garages, trailers, motels/hotels, businesses, desert, and storage.
Toxic Effects of Methamphetamine • Manufacturing • Abuse • Fetal exposure
Children • Children who live in and around the area of the meth lab become exposed to the drug and its toxic precursors and byproducts. • 80-90% of children found in homes where there are meth labs test positive for exposure to meth. Some are as young as 19 months old.
Children • Children can test positive for methamphetamine by: • Having inhaled fumes during the manufacturing process • Coming into direct contact with the drug • Through second-hand smoke.
Children • Hundreds of children are neglected by parents who are meth cooks. Nationally, over 20% of the seized meth labs in 2002 had children present. • In Washington State, the counties of Grays Harbor, Spokane, Thurston, and Klickitat all reported that children were found at half the labs seized in 2002. In Lewis County, children were found at 60-70 %, and in Clark-Skamania, 35%.
Children • In 2002, a total of 142 children were present at lab seizures in Riverside and San Bernardino Counties. • Most children reported as being present during a seizure were school age.
Children • Social workers now accompany law enforcement during lab seizures with children involved. • Parents are often charged with second-degree criminal mistreatment, along with manufacturing charges. • Allowing children to live in a toxic environment where additional risks of explosion and fire are high is considered to be neglect at best to child abuse.
Children are not small adults! • Different diet • Growing & developing rapidly • Higher metabolic & respiratory rate • Developing nervous system • Unusual habits (hand-to-mouth behaviors; close to floor, contact with many surfaces, at risk for all poisonings) • Biologic & developmental vulnerability
DEC RESPONSE TEAM • CORE TEAM MEMBERS: • LAW ENFORCEMENT (24/7) • CHILD PROTECTIVE SERVICES (24/7) • DISTRICT ATTORNEY’S OFFICE (24/7) • MEDICAL PERSONNEL (24/7) • “AUXILIARY” TEAM MEMBERS: • MENTAL HEALTH & THERAPEUTIC PERSONNEL FOR CHILDREN • ENVIRONMENTAL SERVICES, FIRE, & PUBLIC HEALTH • DRUG TREATMENT PROVIDERS FOR PARENTS AND FAMILY MEMBERS
Methamphetamine Addiction The brains of people addicted to Methamphetamine are different than those of non-addicts
FOOD SEX 200 200 NAc shell 150 150 DA Concentration (% Baseline) 100 100 15 % of Basal DA Output 10 Empty Copulation Frequency 50 Box Feeding 5 0 0 Scr Scr Scr Scr 0 60 120 180 Bas Female 1 Present Female 2 Present Mounts Time (min) Sample Number 1 2 3 4 5 6 7 8 9 10 11 12 13 14 15 16 17 Intromissions Ejaculations Source: Di Chiara et al. Source: Fiorino and Phillips Natural Rewards Elevate Dopamine Levels
Effects of Drugs on Dopamine Levels COCAINE AMPHETAMINE Accumbens 1100 Accumbens 400 1000 900 DA 800 DA 300 DOPAC 700 DOPAC % of Basal Release HVA HVA 600 % of Basal Release 500 200 400 300 100 200 100 0 0 0 1 2 3 4 5 hr Time After Amphetamine Time After Cocaine MORPHINE NICOTINE 250 Accumbens 250 Dose (mg/kg) 200 Accumbens 0.5 200 Caudate 1.0 2.5 % of Basal Release 150 % of Basal Release 10 150 100 0 1 2 3 hr 100 0 1 2 3 4 5 hr 0 0 0 1 2 3 4 5hr Time After Nicotine Time After Morphine Source: Di Chiara and Imperato
PET Scan of Long-Term Impact of Methamphetamine on the Brain
Decreased dopamine transporter binding in METH users resembles that in Parkinson’s Disease patients %ID/cc 0.030 0.015 0.000 Control Meth PD Source: McCann U.D.. et al.,Journal of Neuroscience, 18, pp. 8417-8422, October 15, 1998.
2.0 Motor Activity 1.8 1.6 1.4 (Bmax/Kd) Dopamine Transporter 1.2 1.0 7 8 9 10 11 12 13 Normal Control Time Gait (seconds) 2 Memory 1.8 1.6 1.4 Dopamine Transporter Bmax/Kd 1.2 1 16 14 12 10 8 6 4 Methamphetamine Abuser Delayed Recall p < 0.0002 (words remembered) Dopamine Transporters in Methamphetamine Abusers
Cognitive Impairment in Individuals Currently Using Methamphetamine Sara Simon, Ph.D. VA MDRU Matrix Institute on Addictions LAARC
Differences between Stimulant and Comparison Groups on tests requiring perceptual speed