Download
1 / 1
10 likes | 109 Vues
Quantitative Biomarker Imaging for Early Therapy Response Assessment in Cancer. James M. Mountz M.D., Ph.D., University of Pittsburgh. Figure 8 F-18 ML-10 PET (from Siemens mMR Biograph PET/MR ) and Sodium MR Scans at BL and ETA from GBM subject.

E N D
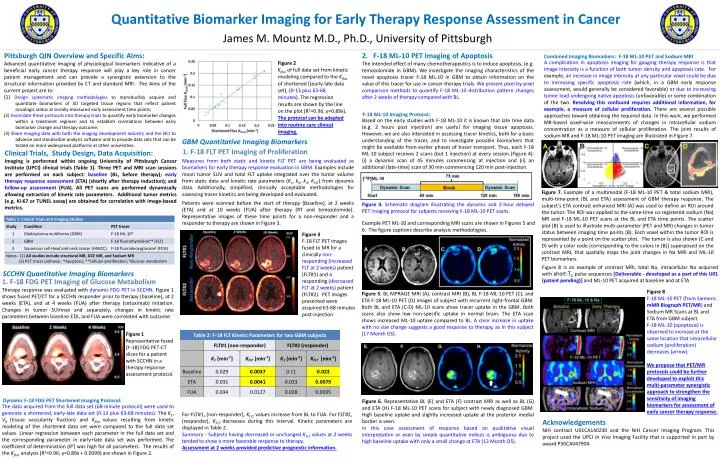
Quantitative Biomarker Imaging for Early Therapy Response Assessment in Cancer James M. Mountz M.D., Ph.D., University of Pittsburgh Figure 8 F-18 ML-10 PET (from Siemens mMR Biograph PET/MR) and Sodium MR Scans at BL and ETA from GBM subject. F-18 ML-10 (apoptosis) is observed to increase at the same location that intracellular sodium (proliferation) decreases (arrow). We propose that PET/MR protocols could be further developed to exploit this multi-parameter synergistic approach to strengthen the sensitivity of imaging biomarkers for assessment of early cancer therapy response. Pittsburgh QIN Overview and Specific Aims: Advanced quantitative imaging of physiological biomarkers indicative of a beneficial early cancer therapy response will play a key role in cancer patient management and can provide a synergistic extension to the structural information provided by CT and standard MRI. The Aims of the current project are to: (1) Design systematic imaging methodologies to reproducibly acquire and quantitate biomarkers of 3D targeted tissue regions that reflect patient oncologic status at serially measured early assessment time points; (2) Assimilate these protocols into therapy trials to quantify early biomarker changes within a treatment regimen and to establish correlations between early biomarker change and therapy outcome; (3) Share imaging data with both the imaging development industry and the NCI to advance and standardize analysis software and to provide data sets that can be tested on more widespread platforms at other universities. 1. F-18 FLT PET Imaging of Proliferation Combined Imaging Biomarkers: F-18 ML-10 PET and Sodium MRI Figure 7. Example of a multimodal (F-18 ML-10 PET & total sodium MRI), multi-time-point (BL and ETA) assessment of GBM therapy response. The subject’s ETA contrast enhanced MRI (A) was used to define an ROI around the tumor. The ROI was applied to the same-time co-registered sodium (Na) MR and F-18 ML-10 PET scans at the BL and ETA time points. The scatter plot (B) is used to illustrate multi-parameter (PET and MR) changes in tumor status between imaging time points (B). Each voxel within the tumor ROI is represented by a point on the scatter plot. The tumor is also shown (C and D) with a color code [corresponding to the colors in (B)] superposed on the contrast MRI, that spatially maps the joint changes in Na MRI and ML-10 PET biomarkers. A complication in apoptosis imaging for gauging therapy response is that image intensity is a function of both tumor density and apoptosis rate. For example, an increase in image intensity at any particular voxel could be due to increasing specific apoptosis rate (which, in a GBM early response assessment, would generally be considered favorable) or due to increasing tumor load undergoing native apoptosis (unfavorable) or some combination of the two. Resolving this confound requires additional information, for example, a measure of cellular proliferation. There are several possible approaches toward obtaining the required data. In this work, we performed MR-based voxel-wise measurements of changes in intracellular sodium concentration as a measure of cellular proliferation. The joint results of sodium MR and F-18 ML-10 PET imaging are illustrated in Figure 7. Figure 2 Kfluxof full data set from kinetic modeling compared to the Kflux of shortened [(early-late data set), (0-13 plus 63-68 minutes). The regression results are shown by the line on the plot (R2=0.96; y=0.89x). The protocol can be adapted into routine care clinical imaging. Measures from both static and kinetic FLT PET are being evaluated as biomarkers for early therapy response evaluation in GBM. Examples include mean tumor SUV and total FLT uptake integrated over the tumor volume from static data and kinetic rate parameters (K1, k2, k3, KFLT) from dynamic data. Additionally, simplified, clinically acceptable methodologies for assessing tracer kinetics are being developed and evaluated. Patients were scanned before the start of therapy (Baseline), at 2 weeks (ETA) and at 10 weeks (FUA) after therapy (RT and temozolomide). Representative images of these time points for a non-responder and a responder to therapy are shown in Figure 3. Figure 3 F-18 FLT PETimages fused to MR for a clinically non-responding (increased FLT at 2 weeks) patient (FLT#1) and a responding (decreased FLT at 2 weeks) patient (FLT#2). PET images presented were acquired 63-68 minutes post-injection GBM Quantitative Imaging Biomarkers • Clinical Trials, Study Design, Data Acquisition: • Imaging is performed within ongoing University of Pittsburgh Cancer Institute (UPCI) clinical trials (Table 1). Three PET and MRI scan sessions are performed on each subject: baseline (BL, before therapy); early therapy response assessment (ETA) (shortly after therapy induction); and follow-up assessment (FUA). All PET scans are performed dynamically allowing extraction of kinetic rate parameters. Additional tumor metrics (e.g. Ki-67 or TUNEL assay) are obtained for correlation with image-based metrics. SCCHN Quantitative Imaging Biomarkers 1. F-18 FDG PET Imaging of Glucose Metabolism Example PET ML-10 and corresponding MRI scans are shown in Figures 5 and 6. The figure captions describe analysis methodologies. 2. F-18 ML-10 PET Imaging of Apoptosis The intended effect of many chemotherapeutics is to induce apoptosis, (e.g. temozolomide in GBM). We investigate the imaging characteristics of the novel apoptosis tracer F-18 ML-10 in GBM to obtain information on the value of this tracer for use in cancer therapy trials. We present pixel-by-pixel comparison methods to quantify F-18 ML-10 distribution pattern changes after 2 weeks of therapy compared with BL. Figure 8 is an example of contrast MRI, total Na, intracellular Na acquired with short-T2pulse sequences [Deliverable - developed as a part of this U01 (patent pending)] and ML-10 PET acquired at baseline and at ETA Therapy response was evaluated with dynamic FDG PET in SCCHN. Figure 1 shows fused PET/CT for a SCCHN responder prior to therapy (baseline), at 2 weeks (ETA), and at 4 weeks (FUA) after therapy (cetuximab) initiation. Changes in tumor SUVmax and separately, changes in kinetic rate parameters between baseline ETA, and FUA were correlated with outcome. Figure 5. BL MPRAGE MRI (A), contrast MRI (B), BL F-18 ML-10 PET (C), and ETA F-18 ML-10 PET (D) images of subject with recurrent right-frontal GBM. Both BL and ETA (C-D) ML-10 scans show tracer uptake in the GBM. Both scans also show low non-specific uptake in normal brain. The ETA scan shows increased ML-10 uptake compared to BL. A clear increase in uptake with no size change suggests a good response to therapy, as in this subject (17 Month OS). F-18 ML-10 Imaging Protocol: Based on the early studies with F-18 ML-10 it is known that late time data (e.g. 2 hours post injection) are useful for imaging tissue apoptosis. However, we are also interested in assessing tracer kinetics, both for a basic understanding of the tracer, and to investigate possible biomarkers that might be available from earlier phases of tracer transport. Thus, each F-18 ML-10 subject receives 2 scans (but 1 injection) at every session (Figure 4): (i) a dynamic scan of 45 minutes commencing at injection and (ii) an additional (late-time) scan of 30 min commencing 120 min post-injection. Figure 1 Representative fused [F-18] FDG PET-CT slices for a patient with SCCHN in a therapy response assessment protocol. Dynamic F-18 FDG PET Shortened Imaging Protocol: Figure 6. Representative BL (E) and ETA (F) contrast MRI as well as BL (G) and ETA (H) F-18 ML-10 PET scans for subject with newly diagnosed GBM. High baseline uptake and slightly increased uptake at the posterior medial border is seen. In this case assessment of response based on qualitative visual interpretation or even by simple quantitative indices is ambiguous due to high baseline uptake with only a small change at ETA (13 Month OS). The data acquired from the full data set (68-minute protocol) were used to generate a shortened, early-late data set (0-13 plus 63-68 minutes). The K1, VB (tissue vascularity fraction) and Kflux values resulting from kinetic modeling of the shortened data set were compared to the full data set values. Linear regression between each parameter in the full data set and the corresponding parameter in early+late data set was performed. The coefficient of determination (R2) was high for all parameters. The results of the Kflux analysis (R2=0.96; y=0.89x + 0.0099) are shown in Figure 2. Figure 4. Schematic diagram illustrating the dynamic and 2-hour delayed PET imaging protocol for subjects receiving F-18 ML-10 PET scans. For FLT#1, (non-responder), KFLT values increase from BL to FUA. For FLT#2, (responder), KFLT decreases during this interval. Kinetic parameters are displayed in Table 2. Summary - Subjects having decreased or unchanged KFLTvalues at 2weeks tended to show a more favorable response to therapy. Assessment at 2 weeks provided predictive prognostic information. Acknowledgements NIH contract U01CA140230 and the NIH Cancer Imaging Program. This project used the UPCI In Vivo Imaging Facility that is supported in part by award P30CA047904.