Download

1 / 47
470 likes | 485 Vues
ESTP course Demetra+ Demetra+ for X12 in Daily Work. Contents of the presentation. 1. Overview of seasonal adjustment at Insee’s short term statistics department 2. Which tools are used? 3. Using SAS to implement additional tools 4. Using Demetra+ to improve quality

E N D
Contents of the presentation • 1. Overview of seasonal adjustment at Insee’s short term statistics department • 2. Which tools are used? • 3. Using SAS to implement additional tools • 4. Using Demetra+ to improve quality • 5. How to make the process safer: controlling refreshment • 6. How to make the process safer: filing
An overview of seasonal adjustment at Insee’s short term statistics department
Which Series are seasonally adjusted ? • IPI : 91 series, NACE3 Level • Turnover Indexes : 440 series, NACE (3-digit) in industry and NACE (5-digit) in other sectors. • All are monthly series.
The seasonal adjustment process • According to ESS Guidelines on seasonal adjustment, we implement two processes : • Each year a complete review of the models • Each month a re-estimation of the parameters of the models defined by the annual process. Outliers are re-identified on the last period. => Partial concurrent adjustment
The seasonal adjustment process • Indirect seasonal adjustment : Seasonally and calendar adjusted series of the aggregates are computed as a weighted sum of their constitutive seasonally and calendar adjusted series.
Methods and tools • Since 2011 we use X12-ARIMA in Demetra+. • We developed a set of SAS macros to do some steps of the annual and monthly campaigns.
The annual seasonal adjustment campaign The annual campaign is done in 8 stages : • Specification of the relevant set of Trading day regressors. Different sets of regressors are considered depending on the sector of activity (retail trade, wholesale trade, services, industry); • Automatic identification of ARIMA model and outliers (X12- Demetra+), with selected TD-regressors. Quality report on new and old treatments are computed; • Comparison of quality reports is made in order to automatically select the best ARIMA model for each series; • Interactive check of results and search for best specifications for problematic series in order to improve quality; • New computation of quality report, if interactive changes of specifications; • Graphical comparison between new and old seasonally adjusted series and return to interactive analysis if needed; • Quality report of the treatment at aggregate level (new and old). • Final search for better specifications for series which cause a decline in quality of aggregates.
Annual SA campaign Demetra+ shows poor diagnostics Interactive search of new specifications. Automoatic identication of model (X12 -Demetra+) Comparison of quality reports => Automatic selection of the best models for each series Specification of relevant set of regressors Unsatisfying quality report Unsatisfying quality report Unsatisfying revisions Quality report for aggregates (old and new treatments) Graphical comparison new/old SA series Quality report
Monthly SA campaign • Update of the raw data file • Seasonal adjustment in Demetra+, launched from SAS. • Interactive check in Demetra+ of seasonal adjustments results and change of some specifications if needed. • Export of results • Saving of the workspace, the linked data file and the specifications in an archive directory.
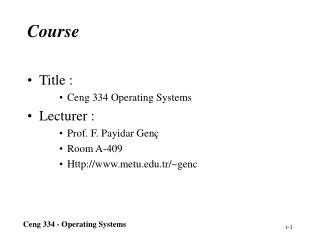
Demetra+ • To seasonally adjust the series (but execution is ordered from SAS (WSACruncher)). • To check quality : detailed examination of results and of diagnostics • To modify specifications in an interactive way if quality is not good enough
Launching Demetra+ from SAS (WSACruncher) • It allows to launch seasonal adjustment from SAS which is the tool in which most of other treatments are done. Allows to generate output (result series and matrix view). Results can then be imported in SAS format as soon as seasonal adjustment is finished. Example : wsacruncher d:\demetra+\test_1.xml -t-p complete • => It limits changes of environment in the computing process of indices, which increases safety of the process. Interactive Demetra+ is only opened to check quality and results.
SAS • To implement additional tools • To increase safety and traceability of the processes => More details later
Excel • Input and output of Demetra+: • Raw data in SAS format are converted to Excel format for being used in Demetra+ • Output generated by Demetra+ (output series + matrix view in .csv format) are converted to SAS format. • More attractive presentation of quality report results : SAS tables from quality report are converted to Excel format. Colours are used to spot problematic series.
Excel Raw data file Excel Output of Demetra+ Tools used in annual process: summary • Sas • Building and selection • of trading day regressors • Creation of specifications sets • for automated treatment • Export of raw data to an • Excel file • Launching of seasonal • adjustment treatment and • generation of output • with cruncher. • Sas • Import of results from Excel • to SAS format • Quality report • Comparison of quality • reports from different • treatments • Saving of final annual • process results • (workspace, data file, • specifications) • Demetra+ • Execution of seasonal • adjustment treatment • Detailed analysis of the treatment • Interactive change of specifications. • New generation of output Excel Results of quality report
Excel Raw data file Excel Output of Demetra+ Tools used in monthly process: summary • Sas • Updating of raw data file • Export of raw data to an • Excel file • Launching of seasonal • adjustment refreshment and • generation of output • with cruncher • Sas • Import of results from • Excel to SAS format • Saving of monthly • process results (workspace, • data file, specifications) • Tool to compare • specifications betwen • month m and month (m+1) • Demetra+ • Refreshment of seasonal • adjustment • Detailed analisys of the treatment • Interactive change of specifications • if necessary. New generation • of output
Computing and identifying sets of trading-day regressors (1) • We developed a specific way to compute our calendar regressors which take into account both French calendar and specificity of each sector of activity under review. • In TRamo-Seats and X12-ARIMA, predefined regressors consider only two cases: Trading-day effect (6 variables: all days are different) or Weekday effect (Monday until Friday are similar but different from Weekend days). • Those cases are not suitable for all sectors of activity, like French retail trade (low activity on Monday, high activity on Saturday)
Computing and identifying sets of trading-day regressors (2) • Automatic selection is made among several sets of regressors (more choice than pre-defined regressors). Criteria for selection: combination of Fisher test (covariance matrix of coefficients in given in Dos version of X12-ARIMA), and Akaike Criterion (AICC, given in Demetra+). • Available sets depend on the sector of activity of the series.
Checking quality (1): an additional tool Aims of this quality report, built in 2007: • Select criteria among many and add some complementary diagnostics • Synthesize this information for each series: • control of the way the quality criteria are summarized • makes the comparison of the quality of different treatments easier • Synthesize information at aggregate level: • way of judging the quality of aggregates • allows a top-down analysis of the quality and to target those series that are “really” problematic Solution: • Assign grades to evaluate different aspects of quality; • Synthesize them for each series (weighted mean of the grades, the weight depending on the importance of the quality criterion); • Aggregate the grades of the series according to the weight of each series in the aggregate series (economic weight).
Checking quality (2): computing grades • Grades (numerical values) are computed by SAS programs. In the columns below the grade is 100 if the null hypothesis of the test is not rejected at 5% level, 50 if it is rejected at 5% but not rejected at 1% level, 0 if it is rejected at 1% level. The overall quality of ARIMA model is computed as a weighted mean of the grades related to the quality of residuals
Checking quality (3): groups of diagnostics The different groups of diagnostics are : • ARIMA modelling quality • Outlier identification (number of outliers, concentration) • Quality of decomposition (residual seasonality or residual trading-day effects, orthogonality of components) • History revisions (+outliers stability) Weighted means of grades are computed to evaluate the quality of the aggregates (indirect seasonal adjustment). Results are summed up in an Excel file.
Comparing quality and results • SAS output of the quality report is exported in Excel file. To compare the quality of two different treatments for a given series, the difference between the synthetic grades are calculated => allow to spot series which show a decline or an improvement of quality. • The quality report also produces a file which contains the characteristics of the treatment (ARIMA model, transformation outliers..). It is then possible to spot differences between the two treatments. • Graphs overlaying results of different treatments are drawn in SAS. It is possible to easily scroll the results.
Changing specifications • It is easy to read and write specifications in SAS (easy link with XML files). Data file specifications Arima model parameters Series span specifications • We create a SAS table containing specifications
Changing specifications automatically SAS allows us • to create mix models (for example old ARIMA models with new regressors). • To fix parts of models (the selected set of regressors for each series). • To change specifications in case of bad diagnostics (to test a model with the maximum number of calendar regressors every time residual calendar effects have been detected).
Do they use the same data file ? Are the two sets of specifications different or not ? Comparing two sets of specifications (1) Do they share the same options to find ARIMA models (initial specifications) ?
Comparing two sets of specifications (2) Two types of specifications can be compared : • It is possible to compare results : the models used to process the series with no care of whether they’re a result of an automated identification or if they were fixed by the user • It is also possible to compare initial options : which process leads to this model ? => Traceability of the history of changes in specifications from month to month.
Interactive use of Demetra (1) • To do a quick check of all series during annual and monthly campaigns: Mains Results menu and Charts menu.
Interactive use of Demetra (2) • For a detailed analysis of problematic series: • « Bad» or « Severe » according to Demetra+ • New automatically identified transformation of the series (logarithm or none) different from the old one. • Charts looking « strange » or very different from the old ones. • Degradation of the quality report grades. Priority is given to series with highest weight in the global index.
How to make the process safer: controlling refreshment
Refreshment • Monthly process : • A new value is added at the end of the series in the data linked file and, generally, previous raw data are revised. • Seasonal adjustment is done in Demetra+. => To take changes in the raw data file into account, refreshment must be performed on the SAProcessing.
2 kinds of specifications • An initial set of specifications (for example automatic ARIMA model identification, test for transformation…) • A final set of specifications (what has been found for each part of the model : ARIMA model, transformation etc.) = specifications from result
Refreshing options There are different options of refreshment (Concurrent, partial concurrent, current) but in all cases: • They read the linked raw data file to update the data contained in the processing. • They take into account initial specifications.
Refreshing options • Example : • Suppose we decide to do a full automated process except for outlier identification, which is disabled. • A « Partial concurrent, all outliers » refreshment is then done. One might think outlier identification would be performed on the full span of data since outliers are supposed to be refreshed…
Refreshing options No new identification is done ! => No outlier identification was requested in initial specifications.
Refreshing options A few remarks : • In a refreshment process, treatments applied to each series can be different according to the differences in their initial specifications • There is no way to easily check what is done for each series
Refreshing options What we want (in monthly campaigns): • The models to be fixed (ARIMA part, outliers before a fixed date, calendar regressors, transformation) • The outliers to be identified only from a fixed date (Demetra+ doesn’t allow to do this). => SAS
Refreshing options A new SAProcessing XML file is written in SAS in which: • Every items of the specifications are fixed. Result specifications of the annual campaign are turned into initial specifications in the monthly processing, but: • Outliers which occur after a fixed date (ex. earliest date of the raw data revision period) are removed (except for some of them we want to keep); • Outlier identification is requested from this fixed date. • “Concurrent” refresh option is then selected (=“complete” in cruncher statement).
Why should the filing of a workspace be made safer ? (1) What we copy :
Why should the storing of a workspace be made safer ? (2) Data saved in the processing : The specifications The path of the linked data file The path to the user-variables is recorded in the Variables xml file Every change in the original file might lead to a change in the filed workspace. Linked to the original data file and to the user-variable data file
What must we do in a filing process to secure our results ? To secure a workspace: The workspace of the monthly or annual process must be copied in an appropriate directory. The path of the linked data files must be changed into the ones copied in the archive directory.
Workspace of monthly process Initial specifications Refresh « complete » with cruncher Result specifications Filing process Archived workspace (month m) Demetra+ workspaces for seasonal adjustment at Insee’s short term statistics department (1) Month m Year y Final workspace of annual campaign Initial specifications Critical value for outliers detection Suppression of outliers from a chosen date (except some of them we want to keep) Result specifications Filing process Archived workspace (year y)
Demetra+ workspaces for seasonal adjustment at Insee’s short term statistics department (2) Month m Month m+1 Updated raw data Workspace of monthly process Workspace of monthly process Initial specifications + possible interactive changes Initial specifications Refresh « complete » with cruncher Refresh « complete » with cruncher Result specifications Result specifications Filing process Filing process Archived workspace (month m+1) Archived workspace (month m)