Download
1 / 50
500 likes | 596 Vues
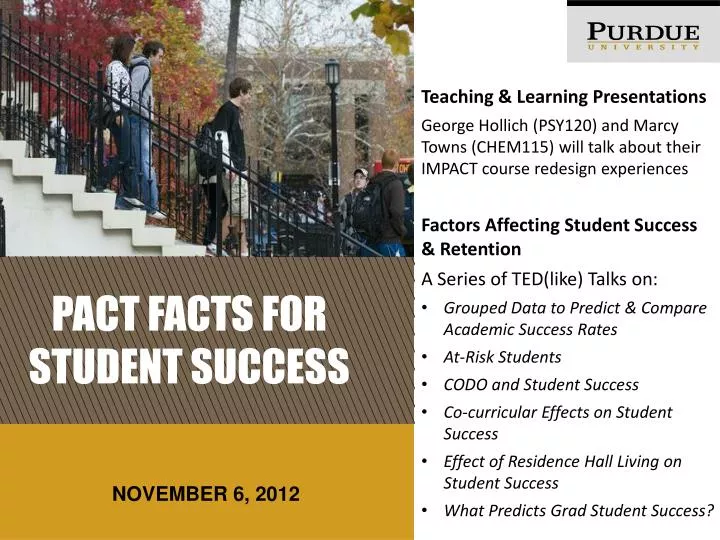
Teaching & Learning Presentations George Hollich (PSY120) and Marcy Towns (CHEM115) will talk about their IMPACT course redesign experiences Factors Affecting Student Success & Retention A Series of TED(like) Talks on: Grouped Data to Predict & Compare Academic Success Rates

E N D
Teaching & Learning Presentations • George Hollich (PSY120) and Marcy Towns (CHEM115) will talk about their IMPACT course redesign experiences • Factors Affecting Student Success & Retention • A Series of TED(like) Talks on: • Grouped Data to Predict & Compare Academic Success Rates • At-Risk Students • CODO and Student Success • Co-curricular Effects on Student Success • Effect of Residence Hall Living on Student Success • What Predicts Grad Student Success? Pact Facts for Student success November 6, 2012
Brent Drake, EMAR • Brenda Schroeder, Advising • Andy Zehner, Student Affairs • Kevin Maurer, Housing & Food Services • Phil Pope, Graduate School • November 6, 2012 Factors affecting student success & retention at purdue
Grouped data Brent Drake, Assistant vice provost & director Enrollment management Analysis & reporting
Grouped Data Predictions Multiple correlations at single institution • Multiple correlations between measures of academic success and unit level student entering academic profiles at one institution tend to lead to correlations of low to moderate effect sizes (Bridgeman, McCamley-Jenkins, & Ervin, 2000) • Some reasons identified in the literature (Stumpf & Stanley, 2002) • Restriction of range inherent in any one institutions academic profile • The interdependence of academic profile variables from high school transcripts and standardized tests • The disparate academic experience of students in one institution
Grouped data predictions Solution based on national sample • Based on Stumpf and Stanley’s 2002 article use grouped data items readily available in two national data sets • Integrated Post-Secondary Education Data System (IPEDS) • 25th and 75th percentile of SAT Scores • US News and World Report National Colleges data set • Percentage of students in top ten percent of high school class • Criterion variable was six-year graduation rates pulled from IPEDS • Final data set consisted of 199 institutions • Multiple correlation for model R2 = 0.8025 distinguishing between graduation rates at different institutions
Grouped data predictions Purdue results • Use national model at university level to predict success among different subgroups • how well are individual colleges performing versus their predicted performance • Overall, Purdue outperforms its predicted rate • Most recent US News Report showed Purdue as a four percentage point over performance as well • The majority of the colleges on the campus over perform as well • Wide range in performance (-6.75 to +38.88)
Section Title At risk students Brent Drake, Assistant vice provost & director Enrollment management Analysis & reporting
At risk students Survey results • Freshmen students surveyed at end of their first year • Questions asked about likelihood of persistence, graduation, and commitment to determine students risk of returning • Purdue has administered last 6 years
At risk students academic factors
At risk students Financial factors
At risk students Campus environment
Section Title Codo-In Survey Brenda schroeder, Academic advising assessment team
CODO-In Survey Academic advising Assessment team The Goal of the Academic Advising Assessment Team is to gain a better awareness and understanding of the strengths and weaknesses of advising at Purdue. Ultimately, it is the team's hope that this process will help improve advising on campus.
CODO-In Survey Survey instrument • Given to all students who CODO • Designed to collect information on: • how students are CODOing, • why they are CODOing, • how they are selecting their majors
CODO-In Survey resources Examples Other: Advisors, Ivy Tech Community College, Krannert, Laying Tracks, Own Research, Walk-Ins Courses: AGEC 20300, AGEC 33100, CDFS 21000, COM 11400, COM 25000, EDPS 10500, EDPS 20000, GS 11900, HIST 15100, MGMT 10000, OLS 25200, OLS 27400, PHPR 10000, PSY 22200, SOC 10000
CODO-In Survey influencers
CODO-In Survey Gpa of codo students
CODO-In Survey Demographics of Codo students
CODO-In Survey Where do they codo to?
CODO-In Survey Where do they codo from?
CODO-In Survey Three expectations of Academic advisor
Section Title Students who do both, do best Co-curricular activities & Academic success Andy zehner, Assessment & data analyst Student affairs
Co-curricular activities Purdue students All grade classifications Semester
Co-curricular activities Student Performance By college
Co-curricular activities What is the Relationship? • Academic success co-varies with engagement • Academic success is subsequent to engagement • Engagement promotes academic success
Co-curricular activities How does engagement Promote academic success? • Most engaged students are excellent to begin with • Engagement imposes order & discipline • Getting involved caps out-of-class activity • Expectations are high • Special tutoring is provided • Menssana in corporesano • Some course credits are relatively easy
Co-curricular activities Academics is primary focus 31% of SAO’s 900+ clubs/organizations
Co-curricular activities 3 out of 5 students devote less than 5 hrs/wk to co-curricular activities
Section Title Residence halls and student success Kevin maurer Director of strategic initiatives & assessment Housing and food services
University Residences Populations Living on Campus University Residences is one of the largest collegiate housing operations in the nation Capacity of 11,779 No live-in requirement for students Fall 2012 Occupancy Single Undergrads 10,696 Single Grads 265 Families 622 Total 11,583 35.6% of all undergrads chose to live in UR – Fall 2012 92.2% of beginning students chose to live in UR for Fall 2012
University Residences Populations Living on Campus
University Residences First year to second Year retention Beginning Student First Year to Second Year Retention Rates The 2008-09 cohort data is accurate, but represents an anomaly.
University Residences Student Success Freshmen Grade Point Average Freshman UR Resident vs. Non-Resident Cumulative Spring Semester GPA
University Residences Student Success Sophomore Grade Point Average Sophomore UR Resident vs. Non-Resident Cumulative Spring Semester GPA
University Residences Student Success Junior Grade Point Average Junior UR Resident vs. Non-Resident Cumulative Spring Semester GPA
University Residences Student Success Senior Grade Point Average Senior UR Resident vs. Non-Resident Cumulative Spring Semester GPA
2010 NSSE Data Differences Among Freshmen Residents and Non-Residents • On-Campus Freshmen were significantly more likely to: • Included diverse perspectives in class discussions or writing assignments • Worked with other students on projects during class • Worked with classmates outside of class to prepare class assignments • Had serious conversations w/ students of a different race/ethnicity than your own • Had serious conversations with students who are very different from you in terms of their religious beliefs, political opinions, or personal values • Had coursework that emphasized: • Analyzingthe basic elements of an idea, experience, or theory, such as examining a particular case or situation in depth and considering its components • Synthesizing and organizing ideas, information, or experiences into new, more complex interpretations and relationships • Making judgments about the value of information, arguments, or methods, such as examining how others gathered and interpreted data and assessing the soundness of their conclusions • Have done or plan to do: Community service or volunteer work • Have done or plan to do: Work on a research project with a faculty member outside of course or program requirements
2010 NSSE Data Differences Among Freshmen Residents and Non-Residents • On-Campus Freshmen were significantly more likely to: • Have supportive relationships with other students • Spend more time preparing for class • Feel the institution encourages contact among students from different economic, social, and racial or ethnic backgrounds • Feel the institution provides the support you need to thrive socially • Had experiences that contributed to: • Acquiring a broad general education • Speaking clearly and effectively • Thinking critically and analytically • Analyzing quantitative problems • Working effectively with others • Learning effectively on your own • Understanding people of other racial and ethnic backgrounds • Solving complex real-world problems • Rate their entire educational experience at Purdue as good or excellent • Say they would attend Purdue again if they could start over
2010 NSSE Data Differences Among Freshmen Residents and Non-Residents • Off-Campus Freshmen were significantly more likely to: • Asked questions in class or contributed to class discussions • Used e-mail to communicate with an instructor • Discussed grades or assignments with an instructor • Have done or plan to do: Independent study or self-designed major • Spend more time working for pay off campus • Spend more time providing care for dependents living with you (parents, children, spouse, etc.)
Explanations? Possible Factors • Committed to Student Success • Learning Communities • 39 communities with 1,129 residents • Resident Assistants • 254 student role models & peer mentors living in the halls • UR Global & BGRi • Initially a UR international mentor program; now collaborating on an early orientation program with ISS and SATS along with 3 iRAs • Co-Curricular Activities • Over 5,100 programs resulting in almost 190,000 meaningful contact hours; Faculty Fellow program • Simply Community • Inherent benefits of living with peers
Section Title Factors affecting grad student retention & success Phil pope Senior associate dean The graduate school
Grad student success Master’s completion And attrition
Grad student success PHD completion And attrition
Grad student success Factors influencing completion And time to degree • Relationships With Major Professors/Mentors • Qualifying/Preliminary Exams • Defined Research Project • Academic/ Professional Environment • Personal/Family Related Stresses • Financial Stresses • Social Stresses
Grad student success initiatives • - Mentoring Workshops for Faculty- Purdue Graduate Student Government (PGSG) – Mentoring Workshops- Peer Mentoring- E-Mentoring Program- Dean’s Annual E-Discussions- Appointment and Re-appointment of Graduate Faculty- Graduate Program Assessment- Graduate School Ombudsman
Grad student success Retention attrition By college
Grad student success Retention attrition By college
Grad student success Retention attrition By college
Grad student success Retention attrition By college
Brent Drake, EMAR • Brenda Schroeder, Advising • Andy Zehner, Student Affairs • Kevin Maurer, Housing & Food Services • Phil Pope, Graduate School • November 6, 2012 questions www.purdue.edu/assessment