Download
1 / 25
250 likes | 372 Vues
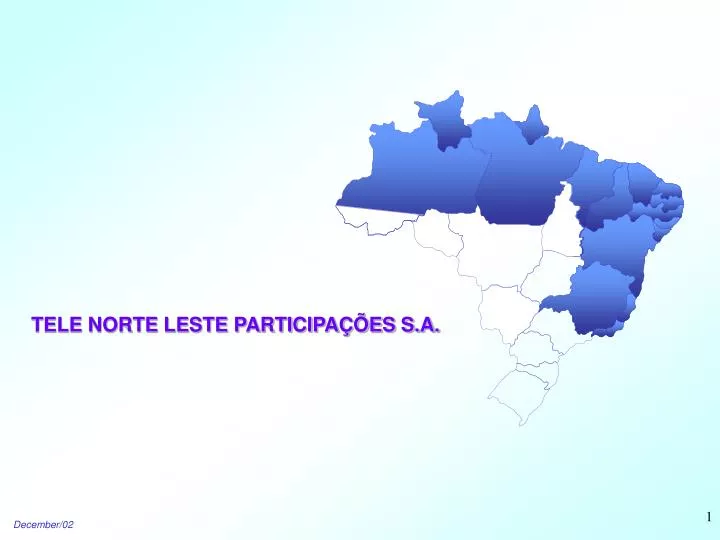
TELE NORTE LESTE PARTICIPAÇÕES S.A. Overview – September / 2002. Largest Integrated Telecom Company in Brazil 15.1 million fixed lines in service 978,000 mobile subscribers (Nov/02) Concession Area: 65% of Brazilian Territory / 93 million people 40% of Country’s GDP

E N D
Overview – September / 2002 • Largest Integrated Telecom Company in Brazil 15.1 million fixed lines in service 978,000 mobile subscribers (Nov/02) • Concession Area: 65% of Brazilian Territory / 93 million people 40% of Country’s GDP Over 21 Million Households • Leadership in Local Services (98% market share) • Domestic and International Long Distance Services • Mobile Services (GSM) • Data, Corporate & Value Added Services • TNLP4: Most Liquid Stock in Brazilian Market (BOVESPA) • High Free Float: 79% of Total Shares • Level 2 ADR (NYSE:TNE): 28% of Total Shares • Market Value: US$ 2.8 billion (Nov/02)
Telemar – Shareholders´ Structure TELEMAR PARTICIPAÇÕES S.A. * FREE FLOAT 18.7% 79.0% TELE NORTE LESTE PARTICIPAÇÕES S.A Treasury Stock 2.3% 24.4% 79.5% ** HICORP** OUTSOURCING TNEXT** TNL ACESSO** CONTAX** TELEMAR Norte Leste (TMAR) Pegasus Free Float Treasury Stock 1.6% 18.9% * Controlling Shareholder * * Wholly owned Subsidiaries
TNE - Capital Structure TOTAL CAPITAL* Capital R$ 4,476,809,955.27 Total Shares: 383,846 million Preferred: 255,897 million Common: 127,949 million BNDESPar Fiago AG Telecom ASSECA Participações Lexpart Part. L. F. Tel BrasilCap BrasilVeículos 25.0% 19.9% 11.3% 11.3% 11.3% 11.3% 5.0% 5.0% 79.0% 18.7% Free Float TELEMAR PARTICIPAÇÕES S.A. Treasury Stock = 2.3% Tele Norte Leste Participações S.A. * 53.0% of TNE common shares
Corporate Structure • Shareholders´ Meetings • At least one annual general meeting • Board of Directors • Monthly Meetings • 11 board members 10 shareholders´ representatives plus the CEO • Board Committees • Independent Accountants PricewaterhouseCoopers • Executive Committee (3 members: CEO’s of TNE, TMAR and Oi)
Superintendent TNE Superintendent TNE CEO TNE Managing Structure Board of Directors Fiscal Committee TNE Executive Committee CFO Strategy and Regulation Asset Management Financial Planning Public Relations Billing Management Procurement Legal Counsel Internal Audit Controlling Treasury/ Investor Relations
Wireline Platform Growth (million lines) Universal Service Targets CAGR (LES) = 23,8% 15 * Acquisition of the Company
Revenue Growth (R$ Mn) Net Revenue CAGR = 25.1%
1st Semester 2nd Semester* 1998 49% 51% 1999 46% 54% 2000 46% 54% 2001 47% 53% Gross Revenue - Quarterly Growth(R$ Mn) 11,739 4Q 9,977 3Q 2Q 1Q * Impact of Service Rate Increase
3Q02 Gross Revenue Breakdown(R$ Mn) 100% 0.0% 5.5% 3Q01 8.5% 5.5% 11.1% 22.4% 3,570 47.7% 100% 6.5% 5.5% 4.0% 10.8% 7.8% 19.8% 4,206 (+ 17.8%) 45.5% Local Fixed- Mobile Network Usage Long Distance Data Mobile Service Other TOTAL
Operating Expenses * (R$ Mn) 6,663 4,811 4,618 4,095 3,470 3,488 * Ex depreciation and amortization
Bad Debt Provisions (as a % of Gross Revenue)
Personnel (Full-Time Employees)
Wireline Productivity Ratio CAGR = 45% ( LIS/ Full-Time Employees)
Revenue per Employee* (R$ 000/ year) (*) Gross Revenue / Full-time employees (wireline) (**) Annualized ratio
Recent Financial Results (R$ Mn) Exchange Loss (3Q02) : Monetary and Exchange Var.: R$ 556 Interest Expenses (CDI based): R$ (228) Dollar Based Financial Rev.: R$ (93) TOTAL: R$ 235 Cash Effect 16 235 = 6.8% Accounting Effect
Capex (R$ Mn)
Net Debt – Quarterly Evolution R$ (Mn)
Local US$ Yen (Swap to US$) CY Basket Cost of Debt Currency Cost (% p.a.) US$ Libor + 5 Yen 1.7 Basket 12.3 Real 16.0 Debt Profile – Currency & Cost (Sep/02) Currency Interest Index 10% CDI 13% 33% 11% TJLP 20% 52% Fixed Rate (Foreign Currency) 15% 46% Floating Rate (Foreign Currency)
Short Term Swap/ Swap to Maturity Hedging Structure USD MM 910 810 5.5% 710 13.1% 13.8% 610 103% 75% 142% 510 72% 50% 410 310 67.6% 210 Short Term Swap 110 Swap to Maturity 10 Unhedged Position 2003 2004 2005 2006 2007 onward Dolar Linked Current Hedge Book Hedging Demand Debt Profile - Hedging Structure (Sep/02)
TNE – PCS ´´Oi´´ - Current Status • 978,000 subscribers in only 6 months of operations (Nov/02); R$ 36.00 ARPU in the 3Q02; 78% pre and 22% post paid clients; Financing US$ 1.4 billion credit (suppliers and bank facilities); Coverage: 14 states – 396 cities; 2,360 integrated sites; GSM National and International roaming (23 countries); Net Revenue in 9 months: R$ 152 million; Total debt in Sep/02: R$ 3.9 billion; Network CAPEX through 2004: R$ 2.7 billion (R$ 1.8 billion until Sep/02).
OUTLOOK 2002 • Lines in Service: +400 K in 2002 • Revenue: New DLD/ILD services and Oi (PCS) • Capex/02: up to R$ 2 bn • Bad Debt: up to 5% of Gross Revenue • Net Debt: around R$ 9bn (2002 YE) • Oi: 1 mn subscribers (2002 YE)
“SAFE HARBOR” STATEMENT This presentation contains forward-looking statements. Statements that are not historical facts, including statements about our beliefs and expectations, are forward-looking statements and involve inherent risks and uncertainties. These statements are based on current plans, estimates and projections, and therefore you should not place undue reliance on them. Forward-looking statements speak only as of the date they are made, and we undertake no obligation to update publicly any of them in light of new information or future events. Investor Relations Rua Humberto de Campos, 425 / 8º andar Leblon Rio de Janeiro -RJ Phone: ( 55 21) 3131-1314/1313/1315/1316/1317 Fax: (55 21) 3131-1155 E-mail: invest@telemar.com.br Visit our website: http://www.telemar.com.br/ri