Download
1 / 22
330 likes | 1.44k Vues
Earth Science 19.3 Regional Wind Systems . Regional Wind Systems . Wind Circulation . Circulation in the middle latitudes is complex.

E N D
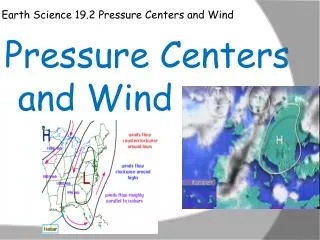
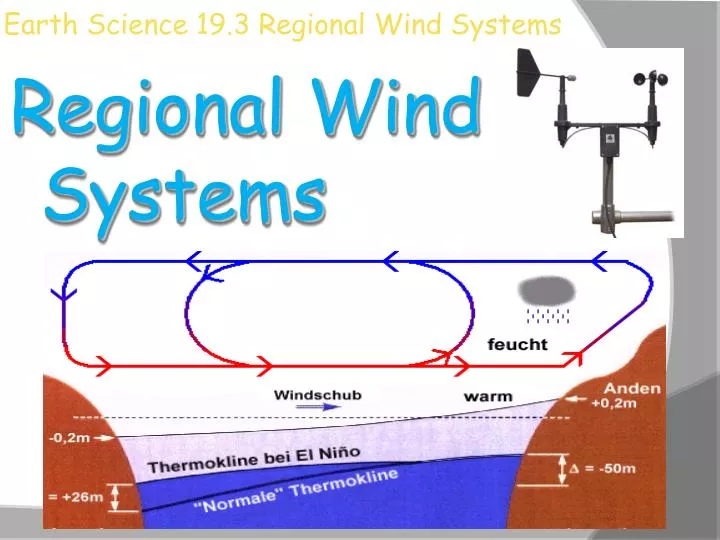
Earth Science 19.3 Regional Wind Systems Regional Wind Systems
Wind Circulation • Circulation in the middle latitudes is complex. • Between 30 and 60 degrees latitude, the general west to east flow, known as the “westerlies”, is interrupted by migrating cyclones (Lows) and anticyclones (Highs). • In the Northern hemisphere, these pressure cells move from west to east around the globe.
Wind Circulation • Small-scale winds produced by locally generated pressure gradient are known as local winds. • The local winds are caused by either topographic effects (such as mountains) or by variations to the surface composition (land or water). 4 types local wind patterns
Land and Sea breezes • In coastal areas during the warm summer months, the land surface is heated more intensely during the daylight hours than an adjacent body of water is heated. • As a result, the air above the land surface heats more, expands and rises; creating an area of lower pressure. • A sea breeze than develops because the cooler air over the water at higher pressure moves toward the land to fill in the low pressure area. • This breeze starts developing shortly before noon and generally reaches it’s greatest intensity during the mid to late afternoon. • These relatively cool winds can have a moderating influence on afternoon temperatures in coastal areas.
Land and Sea breezes • At night, the reverse may take place. • The land cools more rapidly than the sea, and a land breeze develops. • The cooler air, at high pressure over the land, moves to the sea, where the air is warmer and at a lower pressure. • Small scale breezes can also develop along the shores of large lakes. • People who live in cities along the Great Lakes, such as Chicago, recognize the lake effects of winds. • This is why their will be cooler temperatures along the shores of the lakes in the summertime as breezes off the water bring heat relief.
Valley and Mountain breezes • A daily wind similar to land and ocean breezes occurs in many mountainous regions. • During daylight hours, the air along the slopes of mountains is heated more intensely than the air at the same elevation over the valley floor. • Because this warmer air on the mountain slope is less dense, it glides up along the slope and generates a valley breeze. • The occurrence of these daytime upslope breezes can often be identified by the cumulus clouds that develop on adjacent mountain peaks.
Valley and Mountain breezes • After sunset, the pattern may reverse. • The rapid cooling of the air along the mountain slopes produces a layer of cooler air next to the ground. • Because cooler air is denser than warmer air, it moves downslope into the valley. • Such a movement of air is called a mountain breeze. • In the Grand canyon at night, the sound of cool air rushing down the sides of the canyon at night can be louder than the sound of the Colorado River running.
Valley and Mountain breezes • The same type of air drainage can be found in places that have slopes less steep. • The result is that the coldest pockets of air are usually found in the lowest spots. • Like many other winds, mountain and valley breezes have seasonal preferences; they happen more at certain times of the year. • Although valley breezes are most common in the warmer seasons when solar heating is most intense, mountain breezes tend to be more dominant in the colder weather seasons.
How Wind is Measured • Two basic wind measurements; direction and speed, are particularly important to the weather observer. • Winds are always labeled by the direction from which they blow. A north wind blows from the north toward the south. An east wind blows from the east toward the west. • The instrument most commonly used to read wind direction is the wind vane. • Wind vanes are most commonly located on buildings and they always point into the wind. Wind vane and cup anemometer
How Wind is Measured • The wind direction on a wind vane is often shown on a dial connected to the wind vane. • The dial indicates wind direction, either by points or by the compass: north south, east or west, or by a scale 0 to 360 degrees. • On a compass, 0 degrees is north, 90 degrees is east, 180 is south and 270 is west. Wind vane and cup anemometer
Wind Direction • When the wind consistently blows more often from one direction than from another direction, it is called a prevailing wind. • Recall the prevailing westerlies that dominate circulation in the middle latitudes. • In the United States, the westerlies consistently move weather from west to east across the continent.
Wind Direction • Along with this general eastward flow are cells of high and low pressure with the characteristic clockwise and counterclockwise flows. • As a result, the winds associated with the westerlies, as measured at the surface, often vary considerably from day to day and from place to place. • In contrast, the direction of airflow associated with the trade winds is much more consistent.
Wind Speed • Acup anemometer, as seen at right, is commonly used to measure wind speed. • The wind speed is read from a dial much like the speedometer on a car. • Places where winds are steady and speeds are relatively high are potential sites for tapping wind energy.
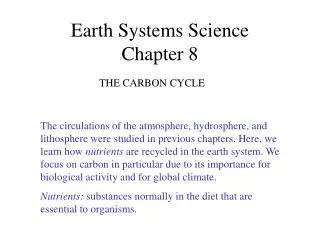
El Niño and La Niña • The cold Peruvian current flows toward the equator along the coasts of Ecuador and Peru. • This flow encourages upwelling of cold nutrient-filled waters that contain food source for millions of fish. • Near the end of the year however, a warm current that flows southward along the coasts of Ecuador and Peru replaces the cold Peruvian current.
El Niño and La Niña • During the 19th century, the local residents name this current El Niño(the child) after the Christ child because it usually appeared during the Christmas season. • Normally, these warm counter-currents last a few weeks and then give way again to the cold Peruvian currents.
El Niño and La Niña • At irregular intervals of three to seven years, these warm countercurrents become unusually strong and replace normally cold offshore waters with warm equatorial waters. • Scientists use the term El Niñofor these episodes of global warming that effect the eastern tropical Pacific. • The onset of El Niñois marked by abnormal weather patterns that drastically affect the countries of Ecuador and Peru.
El Niño and La Niña • As shown at right, these unusually strong countercurrents accumulate large quantities of warm water that block the upwelling of colder, nutrient filled water. As a result, many of the small fish that live off the nutrients from the upwelling no longer survive and prosper. • At the same time, some inland areas that normally are dry and arid receive an abnormally large amount of rain. • These climatic fluctuations have been known for years but had been considered local phenomena.
El Niño and La Niña • When El Niñobegan in the summer of 1997, forecasters predicted that the pool of warm water over the Pacific would displace the paths of both the subtropical and mid-latitude jet streams, as seen in the figure at right. • These jet steams steer weather across North America. • As predicted, the subtropical jet brought rain to the Gulf coast. As well, the mid-latitude jet pumped warm air far north into Canada. As a result, winter temperatures west of the Rockies were far above normal.
La Niña • The opposite of El Niño is an atmospheric phenomenon known as La Niña. • Once thought to be the normal conditions that occur between two El Niño events, meteorologists now consider La Niñaan important atmospheric phenomenon in it’s own right. • Researchers have come to recognize that when surface temperatures in the eastern pacific are colder than average, a La Niña event is triggered that has a distinctive set of weather patterns.
La Niña • A typical La Niña blows colder than normal air over the Pacific Northwest and the northern Great Plains. • At the same time, La Niña warms much of the rest of the United States. • The Northwest also experiences greater precipitation during this time of year. • During the La Niña winter of 1998-99, a world-record snowfall for one season occurred in Washington state. La Niña can also increase hurricane activity.
Global Precipitation • Looking at a map of Global distribution of precipitation, we see that the tropical region dominated by the equatorial low is the rainiest region of the Earth. • It includes the rain forests of the Amazon basin in South America and the Congo basin in Africa. • In these areas, warm humid trade winds converge to yield abundant rainfall throughout the year. • In contrast, areas dominated by the subtropical high-pressure cells are regions of extensive deserts.
Global Precipitation • Variables other than pressure and wind complicate the pattern. • For example, the interiors of large land masses commonly experience decreased precipitation. • However, you can explain a lot about global precipitation if you apply your knowledge of global winds and pressure systems.