Download
1 / 47
710 likes | 1.41k Vues
Tide Gauges. Philip L. Woodworth Permanent Service for Mean Sea Level. Tide poles as ‘gauges’ and as level checks Float tide gauges Acoustic gauges in tube e.g. Next Generation or SEAFRAME systems Acoustic gauges in open air Pressure gauges Radar gauges Contents – ODINAFRICA

E N D
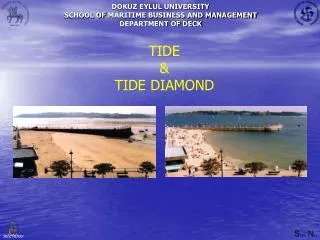
Tide Gauges Philip L. Woodworth Permanent Service for Mean Sea Level
Tide poles as ‘gauges’ and as level checks Float tide gauges Acoustic gauges in tube e.g. Next Generation or SEAFRAME systems Acoustic gauges in open air Pressure gauges Radar gauges Contents – ODINAFRICA Gauges purchased for ODINAFRICA Mountings for radar gauges Contents - General
General References IOC Manuals I-IV, especially Manual IV These can be downloaded from http://www.pol.ac.uk/psmsl/training/
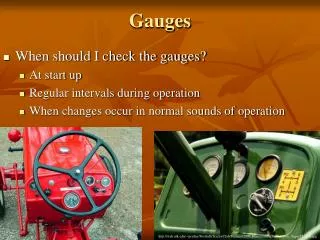
Tide pole gauges • The simplest possible system, and lowest cost • Very educational • Important common sense ‘reality check’ alongside modern black box digital tide gauge systems Of course, tide poles have not for many years been a primary source of sea level data. However, it is always worth having a simple tide pole at every gauge site as a check. Although they are simple, there is a need for datum control, just as there is for more expensive and complicated gauges
Classical Float Gauge
Importance of Float Gauges • They still form a large part of the global network • No need for paper charts now. They can be made digital with the use of shaft encoders • Even if they are now being replaced with acoustic, pressure and radar systems, they were the source of most of the historical record
UK Float Gauge at Holyhead Float gauges are still important components of GLOSS and can be made into digital gauges with the use of encoders
Classical stilling well float gauge from the US east coast high tidal range area
Acoustic gauges • Acoustic systems in tube with Aquatrak transducer (NGWLMS or SEAFRAME) with various data loggers. These are now something of a GLOSS standard in many areas • Acoustic systems in open air or inside the stilling wells of float gauges. Cheap but several groups have not been successful in operating them to good standards
SRD Tide Monitor in a well or in open air – Spain and South Africa have used these not very successfully. Similar systems are manufactured by other companies e.g. MORS
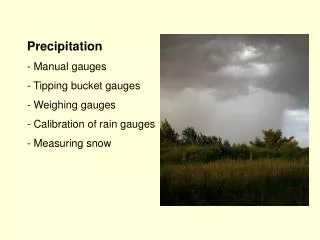
Pressure gauges • Bubbler gauges • Transducer in the sea gauges • ‘B’ (or ‘triple’) pressure systems
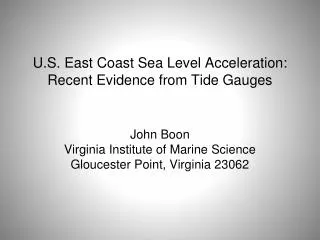
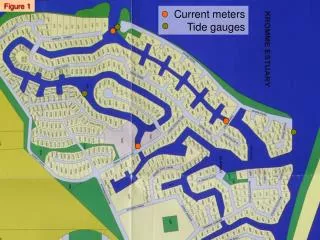
The UK National Tide Gauge Network • 45 stations. • Real-time data used for flood warning. • Delayed-mode data quality controlled for scientific research.
Schematic of the transducer in the sea pressure system Most Appropriate for Tsunami Monitoring
Schematic illustration of a Triple (or ‘B’) pressure gauge setup containing three pressure transducers • This can provide ongoing datum control to the ‘C’ data but can be very expensive
Installation of a ‘B’ gauge – See IOC Manual 4 for more details
Merits of Radar Gauges • Relatively cheap • Easily installed (no need for divers or stilling wells etc.) • Digital so can be ‘real time’ • New technology, but experience so far generally favourable • Several manufacturers • But that means not all can be rigorously tested
Kalesto Calibration • So far as we know, the Kalesto data do not contain an instrumental drift. • BUT it is necessary to calibrate the system at regular intervals: • To provide an initial levelling calibration of Kalesto data relative to the heights of benchmarks • And • (2) To make sure that the calibration does not change with time • See Calibration Document
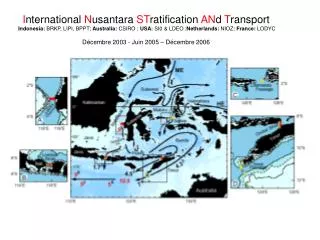
Benchmarks A set of at least 5 benchmarks near to the gauge is required by GLOSS standards, of which one will be the main Tide Gauge Benchmark (TGBM) These should be levelled regularly (e.g. annually) and their levels should be documented by means of ‘RLR diagrams’, with the information passed to PSMSL etc.
ODINAFRICA tide gauges • Radar gauge (OTT Kalesto) ‘tide gauge’ • Pressure gauge as backup to radar and for high frequency sampling ‘tsunami gauge’ • Second pressure gauge as datum check • Data logger (OTT Logosens) • OTT HDR Meteosat DCP • Second telemetry method (e.g. phone, other satellite) • Harbour units for local display
Infrastructure needed • An arm for the radar gauge • Mountings for the pressure sensors (one below low tide and one at approximately MSL) • A simple stilling well for calibration checks • Also power etc. • Note that technical details will be discussed by Peter Foden and Ruth Farre later in the week
As used at Pemba
Progress so far • Identification of realistic new sites Done • Identification of good local contacts Done • Local surveys by consultant – many issues (suitable site, telemetry, security) Done • Purchase appropriate equipment Done • Installation – combination local/consultants • Maintenance - many small problems, distances, problems start after installation! • Ongoing calibration
Things to consider about use of data when the tide gauges are working: Data flow and getting data and products to users: • Local harbour display • Otherwise data goes to UHSLC and Ostend Centre • Can local real-time applications be identified? • Delayed mode quality control and archiving at UHSLC. Can local D-M applications be identified (tide tables, extreme levels …) ? • In future, we want to build on our achievements (e.g. GPS at tide gauges). Ideas?