Download
1 / 25
250 likes | 256 Vues
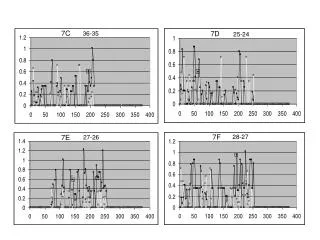
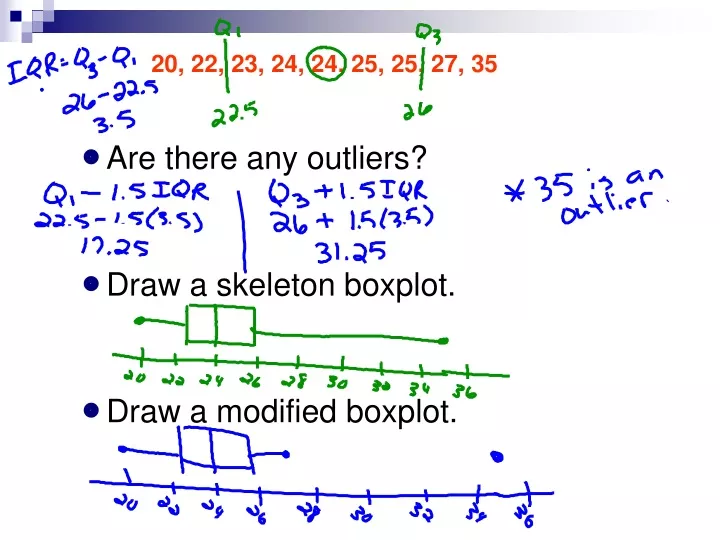
20, 22, 23, 24, 24, 25, 25, 27, 35. Are there any outliers? Draw a skeleton boxplot. Draw a modified boxplot. Boys vs Girls Boxplot. Measures of Position. Percentiles Z-scores. The following represents my results when playing an online sudoku game…at www.websudoku.com. 30 min. 0 min.

E N D
20, 22, 23, 24, 24, 25, 25, 27, 35 • Are there any outliers? • Draw a skeleton boxplot. • Draw a modified boxplot.
Measures of Position Percentiles Z-scores
The following represents my results when playing an online sudoku game…at www.websudoku.com. 30 min 0 min
Introduction • A student gets a test back with a score of 78 on it. • A 10th-grader scores 46 on the PSAT Writing test Isolated numbers don’t always provide enough information…what we want to know is where we stand.
Where Do I Stand? • Let’s make a dotplot of our heights from 58 to 78 inches. • How many people in the class have heights less than you? • What percent of the dents in the class have heights less than yours? • This is your percentile in the distribution of heights
Finishing…. • Calculate the mean and standard deviation. • Where does your height fall in relation to the mean: above or below? • How many standard deviations above or below the mean is it? • This is the z-score for your height.
Let’s discuss • What would happen to the class’s height distribution if you converted each data value from inches to centimeters. (2.54cm = 1 in) • How would this change of units affect the measures of center, spread, and location (percentile & z-score) that you calculated.
National Center for Health Statistics • Look at Clinical Growth Charts at www.cdc.gov/nchs
Percentiles • Value such that r% of the observations in the data set fall at or below that value. • If you are at the 75th percentile, then 75% of the students had heights less than yours.
Test scores on last AP Test. Jenny made an 86. How did she perform relative to her classmates? 6 7 7 2334 7 5777899 8 00123334 8 569 9 03 Her score was greater than 21 of the 25 observations. Since 21 of the 25, or 84%, of the scores are below hers, Jenny is at the 84th percentile in the class’s test score distribution.
6 7 7 2334 7 5777899 8 00123334 8 569 9 03 Find the percentiles for the following students…. • Mary, who earned a 74. • Two students who earned scores of 80.
Interpreting… Why does it get very steep beginning at age 50? When does it slow down? Why? What percent were inaugurated before age 70? What’s the IQR? Obama was 47….
Interpreting Cumulative Relative Frequency Graphs Describing Location in a Distribution Use the graph from page 88 to answer the following questions. Was Barack Obama, who was inaugurated at age 47, unusually young? Estimate and interpret the 65th percentile of the distribution 65 11 58 47
Z-Score – (standardized score) • It represents the number of deviations from the mean. • If it’s positive, then it’s above the mean. • If it’s negative, then it’s below the mean. • It standardized measurements since it’s in terms of st. deviation.
Discovery: Mean = 90 St. dev = 10 Find z score for 80 95 73
Compare…using z-score. History Test Mean = 92 St. Dev = 3 My Score = 95 Math Test Mean = 80 St. Dev = 5 My Score = 90
Compare Math: mean = 70 x = 62 s = 6 English: mean = 80 x = 72 s = 3
Be Careful! Being better is relative to the situation. What if I wanted to compare race times?
Find the following percentiles. • 40th percentile? • 17th percentile? • 70th percentile? • 25th percentile?
Homework • Worksheet