Download
1 / 13
130 likes | 260 Vues
The contribution of Earth degassing to the atmospheric sulfur budget. By Hans-F. Graf, Baerbel Langmann, Johann Feichter From Chemical Geology 147, 1998, 131~145 04-12-01 Woon-sup Choi. Introduction.

E N D
The contribution of Earth degassing to the atmospheric sulfur budget By Hans-F. Graf, Baerbel Langmann, Johann Feichter From Chemical Geology 147, 1998, 131~145 04-12-01 Woon-sup Choi
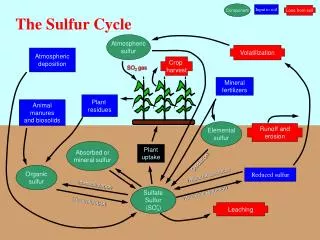
Introduction • Cataclysmic eruptions inject large amounts of sulfur gases (SO2) into the atmosphere oxidized and form sulfate (SO42-) aerosols • Backscatter of solar radiation and Modification of heating of atmospheric layers counteraction to anthropogenic greenhouse effect • Great difficulty in constraining even the magnitude of SO2 fluxes due to the incomplete knowledge of the global state of volcanic activity • An exception: Mt. Etna 6-monthly periodicity of SO2 degassing in relation to the 6-monthly Earth tide
Introduction (cont’d) • Purpose of study • To investigate the relative contribution of tropospheric sulfur emissions from volcanic vs. anthropogenic and biogenic sources • To study the sulfate budgets and the radiative forcing for all source types separately • To examine the regional effects of a specific source (Mt. Etna on Sicily) for different observed emission rate during one winter episode
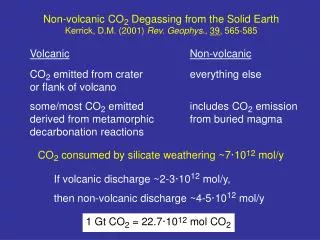
Data and model • Global data • Global sulfur sources estimate (table 1) • Spatial distribution of volcanic emissions by Bates et al.(1987) with proportional addition of the higher emission values resulting from our global estimate
Data and model (cont’d) • Regional data • Observations at Mt. Etna • Full line: monitoring data, dotted line: 10-yr mean emissions (1975~85)
Data and model (cont’d) • Combination of the regional circulation model HIRHAM and Chemistry-Transport-Model (CTM) • For treatment of the liquid water content of clouds and the fractional cloud cover as prognostic variables • Run for one winter episode (Jan 13~23, 1991) with three different emission values in the area • With anthropogenic emissions of 700t SO2/day • With additional 4,000t SO2/day and 20,000t SO2/day released from the summit level of Mt. Etna
Data and model (cont’d) • ECHAM4 • Atmospheric global circulation model • 3.75° horizontal resolution with 19 vertical layers • Up to atmospheric top at 10hPa • Combined with simpler sulfur chemistry module
Results • Global model calculations • Global vertical distribution • Anthropogenic sulfate is found with a total mass of 0.29TgS in Jan: slightly more than volcanic and DMS • Volcanic sulfate (0.35TgS) is almost twice as high as DMS and slightly higher than the anthropogenic sulfate in July • In summer, faster oxidation of SO2 to SO42- more efficient sulfate production
Results (cont’d) • Global vertical distribution (cont’d) • Anthropogenic sulfate: dominant in the lower and middle troposphere • DMS: dominant in high altitude (above 10km) Not deposited in the model at the surface, neither by dry nor wet processes • Volcanic sulfate: dominant in mid-high altitude (above 5km), and significant seasonal variation
Results (cont’d) • Tropical vertical distribution • No large seasonal difference • Volcanic is most abundant in the vertical column • Biomass burning is still negligible • DMS can be transported vertically in the strong tropical uplifts DMS and volcanic sources are equally important in the uppermost troposphere and in the stratosphere
Results (cont’d) • Radiative forcing (table 2) • Significant seasonal difference • SO2 emission from anthropogenic sources is stronger in winter delay of the oxidation into sulfate and the efficient wet deposition of sulfate reduction of the atmospheric lifetime of radiatively active sulfate
Results (cont’d) • Regional model studies-- Mt. Etna • The continuous degassing contributes more to the sulfur burden of the atmosphere than do its few explosive events • 4000t/day of addition only local effects in the episodic mean. However, looking at daily mean values, the influence of Mt. Etna emissions covers greater areas • 20,000t/day of emission enhancement by a factor of about 4.5 in comparison to 4000tSO2 emissions/day • The contribution of Mt. Etna effects to the European sulfate burden, radiative forcing and total sulfur deposition increase nearly linearly with increasing SO2 emissions at Mt. Etna • Only southern Europe is significantly influenced by Mt. Etna emission
Conclusions • Volcanoes mainly inject SO2 H2S into the free troposphere, while anthropogenic sources remain in the planetary boundary layer, where removal processes are very efficient • Single point strong emissions, like from Mt. Etna, have only regional effects. • However, they can lead to sulfur burden in rural areas, which is comparable to that of highly industrialized area • There is urgent need to better understand and monitor the natural emissions of volcanic gases and their time-space variability