Download
1 / 1
10 likes | 247 Vues
-. -. -. -. -. -. -. -. -. -. -. -. -. -. -. -. -. -. -. -. -. -. -. -. +. -. -. -. -. -. -. -. -. -. -. -. -. -. -. -. -. -. -. -. -. -. -. -. -. -. -. +. +. +. +. +. +. +. +. +. +. +. +. +. +. +. +. +. +. +. +. +. +. +. +.

E N D
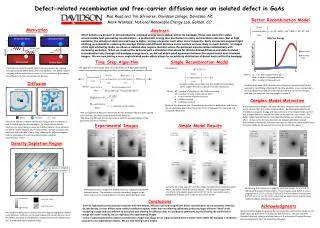
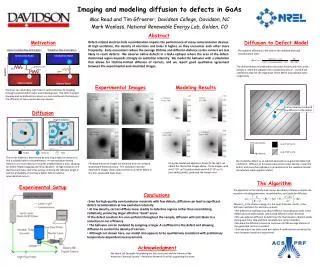
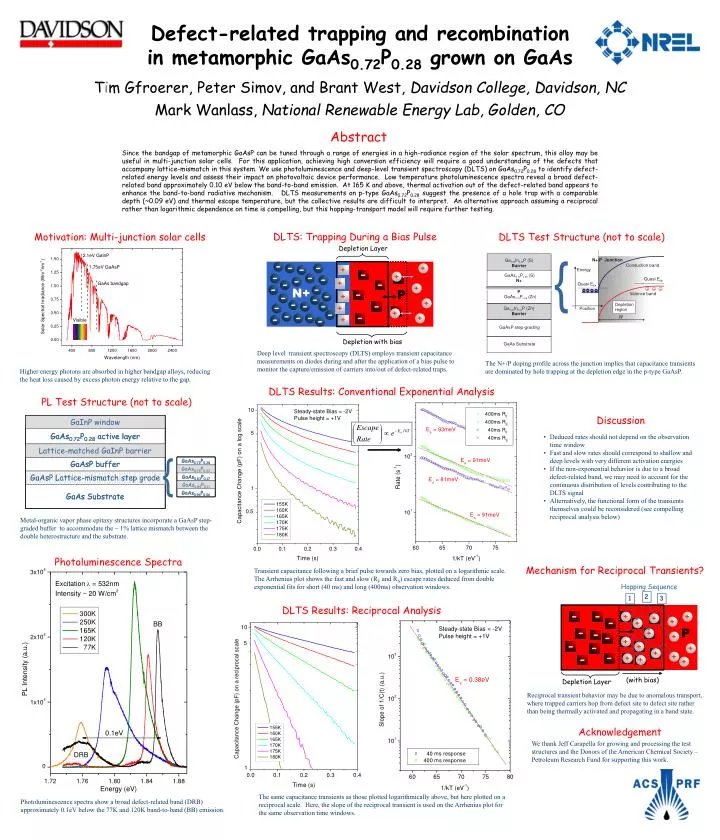
- - - - - - - - - - - - - - - - - - - - - - - - + - - - - - - - - - - - - - - - - - - - - - - - - - - + + + + + + + + + + + + + + + + + + + + + + + + + + + + + + + + + + + + + + + + + + + + - - + + Defect-related trapping and recombination in metamorphic GaAs0.72P0.28 grown on GaAs Tim Gfroerer, Peter Simov, and Brant West, Davidson College, Davidson, NC Mark Wanlass, National Renewable Energy Lab, Golden, CO Abstract Since the bandgap of metamorphic GaAsP can be tuned through a range of energies in a high-radiance region of the solar spectrum, this alloy may be useful in multi-junction solar cells. For this application, achieving high conversion efficiency will require a good understanding of the defects that accompany lattice-mismatch in this system. We use photoluminescence and deep-level transient spectroscopy (DLTS) on GaAs0.72P0.28 to identify defect-related energy levels and assess their impact on photovoltaic device performance. Low temperature photoluminescence spectra reveal a broad defect-related band approximately 0.10 eV below the band-to-band emission. At 165 K and above, thermal activation out of the defect-related band appears to enhance the band-to-band radiative mechanism. DLTS measurements on p-type GaAs0.72P0.28 suggest the presence of a hole trap with a comparable depth (~0.09 eV) and thermal escape temperature, but the collective results are difficult to interpret. An alternative approach assuming a reciprocal rather than logarithmic dependence on time is compelling, but this hopping-transport model will require further testing. DLTS: Trapping During a Bias Pulse Motivation: Multi-junction solar cells DLTS Test Structure (not to scale) Depletion Layer { N+ P Depletion with bias Deep level transient spectroscopy (DLTS) employs transient capacitance measurements on diodes during and after the application of a bias pulse to monitor the capture/emission of carriers into/out of defect-related traps. The N+/P doping profile across the junction implies that capacitance transients are dominated by hole trapping at the depletion edge in the p-type GaAsP. Higher energy photons are absorbed in higher bandgap alloys, reducing the heat loss caused by excess photon energy relative to the gap. DLTS Results: Conventional Exponential Analysis PL Test Structure (not to scale) Discussion • Deduced rates should not depend on the observation time window • Fast and slow rates should correspond to shallow and deep levels with very different activation energies • If the non-exponential behavior is due to a broad defect-related band, we may need to account for the continuous distribution of levels contributing to the DLTS signal • Alternatively, the functional form of the transients themselves could be reconsidered (see compelling reciprocal analysis below) Metal-organic vapor phase epitaxy structures incorporate a GaAsP step-graded buffer to accommodate the ~ 1% lattice mismatch between the double heterostructure and the substrate. Photoluminescence Spectra Mechanism for Reciprocal Transients? Transient capacitance following a brief pulse towards zero bias, plotted on a logarithmic scale. The Arrhenius plot shows the fast and slow (RF and RS) escape rates deduced from double exponential fits for short (40 ms) and long (400ms) observation windows. Hopping Sequence 2 1 3 DLTS Results: Reciprocal Analysis P (with bias) Depletion Layer Reciprocal transient behavior may be due to anomalous transport, where trapped carriers hop from defect site to defect site rather than being thermally activated and propagating in a band state. Acknowledgement We thank Jeff Carapella for growing and processing the test structures and the Donors of the American Chemical Society – Petroleum Research Fund for supporting this work. The same capacitance transients as those plotted logarithmically above, but here plotted on a reciprocal scale. Here, the slope of the reciprocal transient is used on the Arrhenius plot for the same observation time windows. Photoluminescence spectra show a broad defect-related band (DRB) approximately 0.1eV below the 77K and 120K band-to-band (BB) emission.