Download
1 / 76
760 likes | 909 Vues
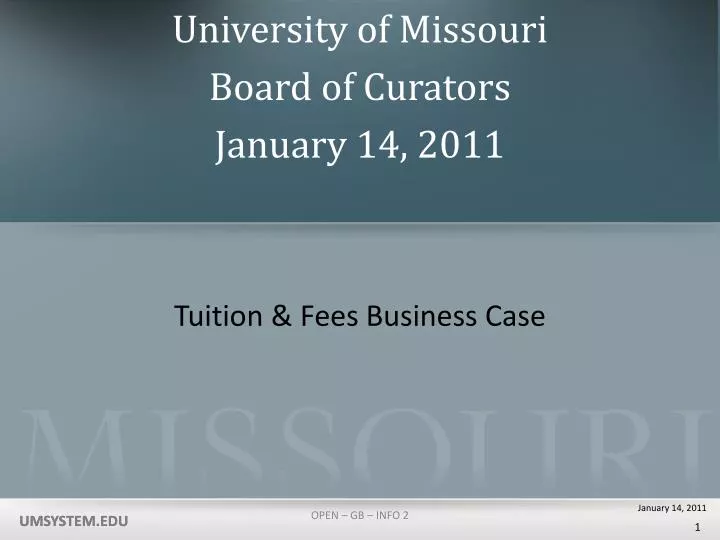
Tuition & Fees Business Case. University of Missouri Board of Curators January 14 , 2011. State support over 10 years has decreased in nominal and real terms. Over the same time period enrollment has grown 28%. State Appropriations per FTE Student have declined 28% over 10 years. $10,462.

E N D
Tuition & Fees Business Case University of Missouri Board of Curators January 14, 2011 OPEN – GB – INFO 2
State support over 10 years has decreased in nominal and real terms OPEN – GB – INFO 2
Over the same time period enrollment has grown 28% OPEN – GB – INFO 2
State Appropriations per FTE Student have declined 28% over 10 years $10,462 $7,510 * *Budget Note: Includes appropriations for Cooperative Extension and Ag Experiment Station OPEN – GB – INFO 2
The University is Educating 35% more FTE students with 25% fewer resources Funding/FTE Student FTE Enrollment 18% Efficiency OPEN – GB – INFO 2
Even with resource constraints the university maintains strong quality metrics • Improved student retention • Sustained entering student quality per ACT scores • Higher graduation rates OPEN – GB – INFO 2
Tuition and Fees have replaced state support as the primary resource for the operating budget * Budget OPEN – GB – INFO 2
The University is committed to responsible stewardship of its resources Efficiency & Effectiveness Report Draft FY2010FY2009 • Cost reduction $ 51.4 m $ 64.2 m • Revenue enhancement $ 16.7 m $ 27.0 m • Strategic reallocation $ 1.9 m $ 7.1 m Total Impact $ 70.0 m $ 98.3 m Note: Cost reduction includes initiatives where costs are avoided, contained, reduced, or eliminated OPEN – GB – INFO 2
Average faculty salaries on all four campuses are in the bottom of their comparator group Faculty Salary Rankings Campus vs. Comparator Institutions (FY2010 IPEDS data) Campus Rank# of Institutions MU 35th 35 UMKC 17th 25 MST 11th 16 UMSL 29th 31 as of FY2009 data OPEN – GB – INFO 2
Average salaries for ranked faculty at comparators have continued to go up in spite of the economy Ranked Faculty Average Salary Changes of Comparators FY09 – FY10 (FY2010 IPEDS data) LowHigh AverageUM MU -1.1% 4.3% 1.4% 0.2% UMKC -5.2% 9.5% 1.3% 0.2% MST -1.5% 9.2% 2.2% 0.4% UMSL -5.2% 9.5% 1.7%-1.4% OPEN – GB – INFO 2
Staff salaries are consistently under market across all occupational groups Staff Salary Peer Comparisonsby Select Occupational Groups 69.5% of mkt UNIV 89.7% of mkt 79.9% of mkt 90.8% of mkt 91.9% of mkt MKT 79.6% of mkt OPEN – GB – INFO 2 *2008 data
Medical, dental & retirement benefit costs are projected to continue to increase placing additional burden on the operating budget OPEN – GB – INFO 2
Investment in Physical Plant is Below Target Creating Deferred Maintenance Backlog DecreasingBacklog Annual Investment Target Increasing Backlog OPEN – GB – INFO 2
The total facilities backlog is over $1.0 billion Facilities Reinvestment & Adaptation Backlog MU $ 589 million UMKC $ 215 million MST $ 173 million UMSL $ 140 million $1,117 million as of FY2009 data OPEN – GB – INFO 2
UM’s state funding gap using the Higher Education Funding formula is $105 million • Based on the academic programs offered, student level & the increase in enrollment since 2006 • Funding deficiency determined by COPHE formula (FY2006 plus inflation) $ 91.9 m • Additional funding gap due to increased enrollment since original study $ 13.1 m • Total State Funding Deficiency $105.0 m OPEN – GB – INFO 2
FY2012 Campus General Operations Budget Planning Mandatory Cost Increases • Salary & Wages – 2% merit pool $ 11.2 m • Benefits on 2% merit pool $ 3.4 m • 3% increase in Benefit Flat Rate $ 15.4 m Total Increase in Compensation $ 30.0 m • Increase in M&R from change in value $ 10.6 m • Add’l Cost to reach M&R 1.5% policy $ 20.6 m • Other Mandatory Cost Increases $ 6.9 m • Costs due to enrollment & Priorities $ 3.6 m Total Cost Increases $ 71.7 m OPEN – GB – INFO 2
FY2012 Campus General Operations Budget Planning Revenue Increases (Decreases) before changes in State Appropriations or Tuition Rates • Increase in Net Tuition and Fees due to Enrollment and Student mix $ 11.2 m • Increase in Supplemental Fees $ 1.0 m • Increase in Recovery of F&A $ 1.2 m • Increase in Other Revenues $ 1.0 m Revenue Increases $ 14.4 m OPEN – GB – INFO 2
FY2012 Campus General Operations Budget Planning Mandatory cost increases $ 71.7 m Revenue increases excluding state appropriations and tuition rate changes $ 14.4 m Funding Gap $ 57.3 m Cuts & Efficiencies Identified to fill gap $ 11.3 m Net Funding Gap $ 46.0 m Impact of 5% cut in state appropriations $ 18.4 m Net Funding Gap w/o tuition changes $ 64.4 m OPEN – GB – INFO 2
The dollar impact of a 1% tuition increase is only $4.4 million Net Funding Gap without rate changes $ 64.4 m Hypothetical Net increase in Tuition & Fees: 1% rate increase $ 4.4m 5% rate increase $ 22.1m 10% rate increase $ 44.2m OPEN – GB – INFO 2
Tuition and required fees at the UM campuses falls in the middle of the range of comparators Range of Tuition and Required Fees Undergraduate Resident Students Comparator Institutions LowHigh Average UM MU $5,238 $15,250 $9,723 $8,501 UMKC $5,198 $14,936 $8,381 $8,602 MS&T $4,944 $40,680 $24,057 $8,528 UMSL $4,759 $14,140 $7,984 $8,631 OPEN – GB – INFO 2
UM tuition & required fees have -0- increase over two years compared to double digit increases at some comparator institutions Percent Change in Tuition & Required Fees Undergraduate Resident for FY2010 & FY2011 Comparator Institutions LowHigh AverageUM MU 1.4% 22.4% 10.1% 0.0% UMKC 0.6% 16.0% 6.6% 0.0% MS&T -0.5% 15.2% 7.0% 0.0% UMSL 0.0% 15.2% 6.6% 0.0% OPEN – GB – INFO 2
Spikes in Tuition Have Been in Response to Reductions in State Support * *Estimate OPEN – GB – INFO 2
Spikes in Tuition Have Been in Response to Reductions in State Support(30 Years) * *Estimate
Tuition Increases Have Averaged 2.92% for 10 out of the last 13 years Fiscal Year OPEN – GB – INFO 2
Institution Financial Aid for Undergraduates almost doubled over the past 10 years. Institutional Grant Aid ($ Million) OPEN – GB – INFO 2
FY 2012 Tuition and Fees Recommendations in January • Campuses tuition will be decoupled • Market considerations • Sustaining quality balanced against access and affordability • Investments critical to mission • Strive to keep increase to single digit, depending on level of state support OPEN – GB – INFO 2
Questions and Discussion OPEN – GB – INFO 2
Campus Data OPEN – FIN – INFO 2
Campus Data MU OPEN – FIN – INFO 2
FY2012 Funding Gap In General Operations for MU Mandatory Cost Increases • Salary & Wages – 2% merit pool $ 5.8 m • Benefits on 2% merit pool 1.5 m • 3% increase in Benefit Flat Rate 7.4 m Total Increase in Compensation $14.7 m • M&R at 1% policy rate 6.3 m • Add’l Cost to reach M&R 1.5% policy 9.9 m • Other Mandatory Cost Increases 4.6 m • Costs due to Enrollment & Priorities 2.4 m Total Cost Increases $37.9 m OPEN – FIN – INFO 2
FY2012 Funding Gap In General Operations for MU Revenue Increases (Decreases) before changes in State Appropriations or Fee Rates • Increase in Net Tuition and Fees due to Enrollment and Student Mix $ 6.1 m • Increase in Supplemental Fees 0.4 m • Increase in Recovery of F&A 0.4 m • Increase in Other Revenues 0.4 m Revenue Increases $ 7.3 m OPEN – FIN – INFO 2
FY2012 Funding Gap In General Operations for MU Mandatory cost increases $ 37.9 m Revenue increases excluding state appropriations and fee rate changes 7.3 m Funding Gap $ 30.6 m Cuts & Efficiencies Identified to fill gap 9.0 m Net Funding Gap $ 21.6 m Impact of 5% cut in state appropriations 9.1 m Net Funding Gap without rate changes $ 30.7 m OPEN – FIN – INFO 2
FY2012 Funding Gap In General Operations for MU Net Funding Gap without rate changes $30.7 m Net increase in Tuition & Fees from: 1% rate increase $ 2.2 m 5% rate increase $11.0 m 10% rate increase $22.0 m COPHE Formula Calculated Gap (adjusted) $ 48.0 m Facilities Reinvestment & Adaptation Backlog $589.0 m OPEN – FIN – INFO 2
MU Campus Campus Process for Setting Tuition & Fees OPEN – FIN – INFO 2
Tuition and Fee Process at MU • Fall Campus Budget Discussions * • Fall Divisional Budget Meetings • Budget Scenario Building and Review • Bi-monthly Enrollment Projections • Comparison of Peer Institution Rates • Elasticity Considerations * Faculty, Staff, Students and External Groups
Fall 2010 Applicants to MU Who Enrolled Elsewhere By State Where They Enrolled
MU Tuition and Required Fees Undergraduate Resident Students Comparator Institutions FY2011 LowHigh AverageMU $5,238 $15,250 $9,723 $8,501 Comparator Increases for FY2011 LowHigh AverageMU 1.4% 22.4% 10.1% 0.0% Competitor Institutions FY2010 LowHigh AverageMU $6,276 $31,342 $11,384 $8,501 Comparator Group: AAU OPEN – FIN – INFO 2
Campus Data UMKC OPEN – FIN – INFO 2
FY2012 Funding Gap In General Operations for UMKC Mandatory Cost Increases • Salary & Wages – 2% merit pool $ 2.7 m • Benefits on 2% merit pool 1.1 m • 3% increase in Benefit Flat Rate 4.2 m Total Increase in Compensation $ 8.0 m • M&R at 1% policy rate 2.3 m • Add’l Cost to reach M&R 1.5% policy 4.6 m • Other Mandatory Cost Increases 1.4 m • Costs due to Enrollment & Priorities 0.3 m Total Cost Increases $16.6 m OPEN – FIN – INFO 2
FY2012 Funding Gap In General Operations for UMKC Revenue Increases (Decreases) before changes in State Appropriations or Fee Rates • Increase in Net Tuition and Fees due to Enrollment and Student Mix $ 2.5 m • Increase in Supplemental Fees 0.3 m • Increase in Recovery of F&A 0.5 m • Increase in Other Revenues 0.0 m Revenue Increases $ 3.3 m OPEN – FIN – INFO 2
FY2012 Funding Gap In General Operations for UMKC Mandatory cost increases $16.6 m Revenue increases excluding state appropriations and fee rate changes 3.3 m Funding Gap $13.3 m Cuts & Efficiencies Identified to fill gap 0.8 m Net Funding Gap $12.5 m Impact of 5% cut in state appropriations 4.0 m Net Funding Gap without rate changes $16.5 m OPEN – FIN – INFO 2
FY2012 Funding Gap In General Operations for UMKC Net Funding Gap without rate changes $16.5 m Net increase in Tuition & Fees from: 1% rate increase $ 1.0 m 5% rate increase $ 5.1 m 10% rate increase $10.3 m COPHE Formula Calculated Gap (adjusted) $ 22.4 m Facilities Reinvestment & Adaptation Backlog $215.0 m OPEN – FIN – INFO 2
UMKC Campus Campus Process for Setting Tuition & Fees OPEN – FIN – INFO 2
UMKC Campus UMKC Process for Setting Tuition & Fees • Where do our students come from? • 75% from Kansas City MSA (58% from Missouri, 17% from Kansas) • “91% from Missouri and Kansas City MSA” • 22% from areas where median income is less than $40K; 28% of students are Pell eligible • Who are our competitors? • Students who were admitted, but did not enroll at UMKC chose to attend MU, Missouri State, Truman State, Northwest Missouri State, KU, K-State OPEN – FIN – INFO 2
UMKC Campus • Tuition considerations • Access and Affordability • 28% of our students are Pell eligible, indicating high need for financial assistance • Market position compared to competitors • Campuswide input and buy-in to tuition and fee rates • Missouri-based competitors are facing the same pressures • Our price position should not change if our actions are similar • We are competitive in Kansas and should remain so with expanded metro rate • Promoting Value Proposition • 13:1 student to faculty ratio • Nationally recognized programs • Enhanced campus life experience • Unique urban campus • Focus on retention – A2S initiatives, early alert system, improved academic advising OPEN – FIN – INFO 2
UMKC Tuition and Required Fees Undergraduate Resident Students Comparator Institutions FY2011 LowHigh Average UMKC $5,198 $14,936 $8,381 $8,602 Comparator Increases for FY2011 LowHigh Average UMKC 0.6% 16.0% 6.6% 0.0% Competitor Institutions FY2010 LowHigh Average UMKC $5,626 $7,414 $6,624 $8,272 OPEN – FIN – INFO 2
Campus Data Missouri S&T OPEN – FIN – INFO 2
FY2012 Funding Gap In General Operations for Missouri S&T Mandatory Cost Increases • Salary & Wages – 2% merit pool $ 1.2 m • Benefits on 2% merit pool 0.3 m • 3% increase in Benefit Flat Rate 1.7 m Total Increase in Compensation $ 3.2 m • M&R at 1% policy rate 0.2 m • Add’l Cost to reach M&R 1.5% policy 2.7 m • Other Mandatory Cost Increases 0.4 m • Costs due to enrollment & Priorities 0.8 m Total Cost Increases $ 7.3 m OPEN – FIN – INFO 2
FY2012 Funding Gap In General Operations for Missouri S&T Revenue Increases (Decreases) before changes in State Appropriations or Fee Rates • Increase in Net tuition and Fees due to Enrollment and Student Mix $ 1.7 m • Increase in Supplemental Fees 0.3 m • Increase in Recovery of F&A 0.0 m • Increase in Other Revenues 0.5 m Revenue Increases $ 2.5 m OPEN – FIN – INFO 2