Download
1 / 32
420 likes | 740 Vues
Leveraged Buyouts. Characteristics Evidence on LBOs An LBO (Private Equity) Model Reverse LBOs. Definition of an LBO. No precise definition -- different forms

E N D
Leveraged Buyouts Characteristics Evidence on LBOs An LBO (Private Equity) Model Reverse LBOs Wharton School
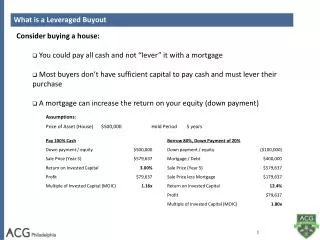
Definition of an LBO • No precise definition -- different forms • Transaction in which a group of private investors uses debt financing to purchase a corporation or a corporate division. Equity securities of the company are no longer publicly traded, though the debt and preferred stock may be publicly traded. Uses entire borrowing structure • Often involves an LBO sponsor who contributes capital and expertise (KKR, Bass Brothers, Blackstone, etc.) and management team. Wharton School
Distinct Features of an LBO • Significant increase in financial leverage • Average debt/total capital increases from 20% to 70% • Management ownership interest increases • Median ownership of a Fortune 500 U.S. Corporation is 0.5%, for Value Line 1000 is 5% • After an LBO the ownership is 10% - 35% • Non-mgmt equity investors join the board • Before an LBO, non-management directors have almost no ownership. After, non-management directors may represent 40%-60% of equityholders • Typical board of 5 individuals, 2-3 from the LBO sponsor Wharton School
Characteristics of Potential LBO Candidates • History of profitability • Predictable cash flows to service financing • Low current debt and high excess cash • Readily separable assets or businesses • Strong management team - risk tolerant • Known products, strong market position • Little danger of technological change (high tech?) • Low-cost producers with modern capital • Take low risk business, layer on risky financing Wharton School
Typical LBO Structure • Varies over time with market conditions • Debt Financing • Total debt often 60-80% of entire deal (4-5 x LTM EBITDA, but depends on industry, cash flow, etc. • 40% - 60% senior bank debt (repayment in 5-7 years) • 0-15% senior subordinated (repayment in 8-12 years) • 0-20% junior subordinated (repayment in 8-12 years) • 0 - 15% preferred stock • 10% - 50% common equity • Equity Ownership • 10% - 35% management/employee owned • 40% - 60% investors with board representation • 20% - 25% owned by investors not on board Wharton School
LBO Financing • LBO sponsors have equity funds raised from institutions like pensions & insurance companies • Some have mezzanine funds as well that can be used for junior subordinated debt and preferred • Occasionally, sponsors bring in other equity investors or another sponsor to minimize their exposure • Balance from commercial banks (bridge loans, term loans, revolvers) & other mezzanine sources • Banks concentrate on collateral of the company, cash flows, level of equity financing from the sponsor, coverage ratios, ability to repay (5-7 yr) Wharton School
LBO Financing – Senior Bank Debt • Senior bank debt which is secured with assets like receivables, inventory, PP&E is often priced at T-Bills, LIBOR or prime + 400 to 700 basis points (recently spreads were much lower). • Often in tranches where first tranche is repaid quickly and other tranches are not due until maturity (7-8 year maturity with average life of 4-5 years) • 2.5 – 3.5 x LTM EBITDA (varies by industry and rating) • Lend up to X % (40%-65%) of receivables less than Y (90) days, over certain $ amount, at T-Bill, LIBOR or Prime, plus a risk premium • Inventory usually 20% to 60% • Securities 10% to 90% (US Govt Bonds @ 90%) • PP&E (Cars (60%), Computers (25%), Building (60% to 70%, unique factories (10% to 30%) • Bankers like to see 25% to 35% equity for protection Wharton School
LBO Financing – Unsecured Debt • Unsecured debt (senior and junior) • Potentially many different pieces (cash pays are senior and senior subordinated while junior subordinated may be zero coupon issued by holding company) • Longer maturity than bank debt • Covenants not to pay dividends, increase debt or sell assets • Supported by cash flows and operations of the business. • High-yield a favorite (senior subordinated), but hard to sell high yield for less than $150 million and high-yield market not always viable. • High-yield is typically non-callable for about five years and then have call penalties for 3-5 years. Wharton School
Junior Subordinated and Preferred • Below the high-yield bonds (or below the bank debt if the deal isn’t big enough to support high-yield bonds) but above the common would be junior subordinated and preferred stock. • Junior subordinated may be PIK (zeros) for some time period. May be issued by a holding company of the operating company and may be issued with warrants. Holding company notes almost always PIK because there is no cash flow into the holding company for some time. • In transactions of this type, the PIK interest may not be deductible until it is paid in cash or the bond matures and is paid off (so called AHYDO rules) • Preferred can be PIK as well, so dividends accrue but are not paid and at sale of the company the preferred holders get their investment plus accrued dividends (often call the liquidation preference) -- often sold with warrants. Alternatively, can issue convertible preferred instead of including warrants. Wharton School
Common Equity • Typically 25% - 35% of capital structure now, but varies over time. • Typically seeking a 20%-30% IRR • Often assume exit and entry multiples are the same, but not necessarily a good assumption – rarely expect multiple expansion • Ask what the exit strategy is likely to be. Wharton School
Management Ownership • Management puts up 60% to 70% of wealth (excluding residence) • Management share of equity (sometimes called management promote) usually increases year by year as they meet targets (e.g., revenue and EBITDA and non-financial targets) through performance vesting options. Strike price usually at equity buy-in price at time of deal. • Managers are sometimes offered chance to buy stock with a mixture of recourse and non-recourse notes – potential tax advantages for managers. • Managers often already own shares in a company that does an LBO and they do not necessarily cash out those shares – that equity goes into the new entity – called rollover equity. Wharton School
LBO Sponsors • Typically won’t put more than certain percentage of a fund in one company and another percentage of a fund in one industry. Increases in % of financing that is equity has caused deal sharing. • Razor edge margins because of the high risk profiles. Shooting for 20% - 30% on every deal, some earn 100%, some 4%, some -80%, etc. • Sponsor takes funds from pension funds only when required, a draw down notice (LBO sponsors do not want to be generic portfolio managers). • Typically assume will take 3-5 years to invest a fund and then another 3-5 years to cash out (monetize) the investments. • Expertise in layering risk, financial structure Wharton School
LBO Sponsors • Normally get a management fee that is 1% to 1.5% of fund size. • In addition, they split returns between investors and themselves and often get a percentage in the capital gain of the fund (so called carried interest). • In addition, they invest their own money in the fund. Wharton School
Financial Sponsor M&A Activity 1999-2007 Global Sponsor M&A Activity $ in billions % of Total Value $1,105 ___________________________ Source: SDC. Wharton School 13
Risk Profile Questions • Is cash flow consistent (no cyclical industries)? • Is a turnaround required to meet projections? • Any outside threats to long-term performance? • Are there larger, better capitalized competitors? • Does the firm have high quality management? • Are there other successful LBOs in that industry? • Can the company grow with the leverage increase? • What is the exit strategy? Wharton School
U.S. LBO Acquisition Financing Market Trends Sample Capital Structure Terms for Leveraged Deals Average Debt Multiples 6.7x 6.0x 5.8x 5.7x 5.3x 5.2x 5.2x 5.4x 5.2x 5.0x 4.5x 4.4x 4.4x 4.1x 4.0x 4.2x 3.8x 3.7x Average Equity Contribution to LBO 45% 43% 42% 41% 40% 38% 35% 36% 34% 34% 33% 26% 25% 24% 23% 22% 22% 13% 10% ________________ Source: S&P Leveraged Commentary & Data. Excludes media loans. Too few deals in 1991 to form a meaningful sample. Wharton School 30
Exit Strategies • Exit strategies include: • IPO • Buyout by a strategic buyer • Buyout by another financial buyer • Leveraged recapitalization --- not really an exit, but essentially after the debt is paid down to a reasonable level, the entity issues a new round of debt and pays a large dividend to equityholders (or repurchases shares). Some, but not all, equityholders may be taken out. Wharton School
Potential Motivations for an LBO • Increase in debt and concentrated ownership increase incentives to maximize value. • Non-management on board with significant equity stakes increases board effectiveness • Advantage to being private (filings, etc.) • Beneficial tax consequences (debt, step-up) • Transfer wealth from other stakeholders in the firm such as employees & bondholders Wharton School
Performance of LBOs • Evidence indicates that the median premium paid to existing shareholders is 42% (1980’s data). • What are the potential sources of value? • Improved operating performance • wealth transfers from employees • reduction of taxes • wealth transfers from pre-buyout debtholders • overpayment by post-buyout investors Wharton School
Changes in Median Performance • In three year period after the buyout relative to the year before the buyout (1980s data) • EBIT increases by 42% • EBIT/assets increases by 15% • EBIT/sales increases by 19% • EBIT-CAPEX increases by 96% • EBIT-CAPEX/assets increases by 79% • EBIT-CAPEX/sales increases by 43% • working capital management improves • no decline in advertising, maintenance or R&D • CAPEX falls by 33% relative to industry Wharton School
Transfers from Employees • No evidence that investor wealth gains can be attributed to wage reductions or layoffs • median change in number of employees is 0.9% among all LBOs and is 4.9% among LBOs that did not engage in divestitures • significant increase in average annual compensation for non-management employees • there is evidence that LBOs are not adding to their payrolls at the same rate as the industry (12% declines for all, 6.2% decline for those with no divestitures) Wharton School
Tax Effect of LBOs • Firms’ interest deductions increase substantially after an LBO. Depending on how you value them & how long you think the highly levered structure will be in place, 21% to 70% of the premium is attributable to the interest • Additional depreciation (pre-1986 Tax Reform Act accounted for at least 30% of the premium • Ratio of federal taxes/EBIT falls from 20% pre-buyout to 1% for 2 yrs. after buyout. Wharton School
Transfers from Bondholders • If leverage increases dramatically, pre-buyout debtholders with no protection could experience wealth losses • on average, pre-buyout debtholders lost 2.1% • represents 3% of the premium paid • wealth losses accrue only to those bondholders not safeguarded by protective covenants (limitations on debt issuance, etc.) Wharton School
Overpayment by Post-Buyout Investors • Evidence indicates over three years subsequent to the buyout, post-buyout equity investors earned a mean excess return of 45% (again, 1980s data). • Evidence for debtholders is less clear as it is difficult to track bonds that default. Default rates on low grade bonds were roughly 2.5% per year, but returns are less easily quantified Wharton School
John Harland -- An LBO? • Typical LBO Model • Model cash flows -- see how it supports the debt financing structure • Treat exit year as a choice variable to determine sensitivity of IRR to exit date. • Determine the IRR for the mezzanine and equity providers and see if it hits target • Models don’t typically assess value except as exit multiple (can do DCF of course) Wharton School
LBO Models as an Alternative Valuation • LBO models can serve as an alternative valuation. • Take the cash flow forecasts, determine the amount of financing available in the market place currently and the IRR that LBO sponsors would target for this company. Based on all that, determine the maximum amount that could be paid as an LBO transaction that satisfies the required IRR. • Triangulate with DCF and Market Multiple Valuations Wharton School
LBO Model Logic • Create a sources (debt, equity contribution) and uses (purchase price, fees, debt payoff) statement for inception of LBO • Debt schedules • Proforma balance sheet, income statement and statement of cash flows based on operating assumptions • Cash flows pay down the debt (senior first and then mezzanine) • Perform valuations at alternative exit dates and determine IRR to equity holders Wharton School
Reverse Leveraged Buyouts • Reverse LBO occurs when an LBO goes public • Constituted roughly 10% of IPO market in 1980s • Leverage and ownership changes at time of reverse LBO that moves them back toward pre-LBO structure • Leverage falls from 83% to 56% (debt/capital) • Inside ownership falls from 75% to 49% (management and board -- includes sponsor). • Board size increases from 5 to 7, roughly 1/3 each of operating management, non management capital providers and external board members Wharton School
Financial PerformanceOCF Before Interest and Taxes • Year Firm Industry-Adjusted • -1 19.3% 9.2% • 0 14.6% 4.7% • +1 11.9% 1.5% • +2 14.3% 4.1% • +3 13.5% 2.4% • Avg +1 to +3 13.9% 2.9% • Doing much better than their industry, but evidence of deterioration relative to prior performance Wharton School
Discretionary Expenditures • Discretionary expenditures defined as capital expenditures, advertising and R&D. • Spending as much as their industry prior to the reverse LBO and increases subsequently (discretionary expend./sales) 2% greater than industry • CAPEX low before reverse LBO and normal after • Advertising above industry before and after • R&D tracks industry before and after • Employees/sales same as industry both before and after the reverse LBO Wharton School
Effect of ownership and leverage • No evidence that changes in leverage affect performance • Significant correlation between decline in performance and decline in ownership. • 10% additional decline in percentage equity owned by managers results in an additional 3.6% fall in OCF/assets over three subsequent years • 10% additional decline in percentage equity owned by non-management insiders results in an additional 4.1% fall in OCF/assets over three subsequent years • Suggests important role for ownership incentive Wharton School
Stock Market Performance • Evidence of a large increase in stock prices of the reverse LBO firms over the next four years. • Large increase in stock prices exactly tracks the stock market. As such, there is no evidence of positive or negative excess returns • Very different from IPOs in general. Strong evidence of negative excess returns Wharton School