Download
1 / 17
170 likes | 242 Vues
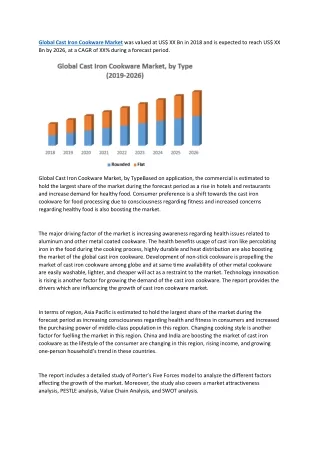
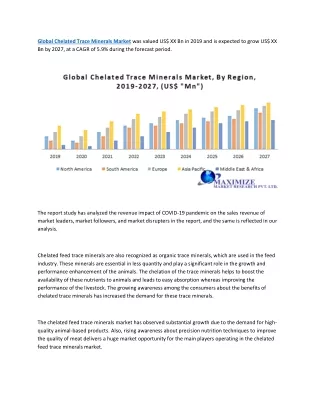
The global chelated iron micronutrient market was valued at around US$ 34.7 million in 2014.

E N D
Global Market Study on Chelated-Iron Agricultural Micronutrient - Latin America to Witness Highest Growth by 2020 Persistence Market Research Global Chelated-Iron Agricultural Micronutrient Market is Expected to be valued at US$51.4 Mn by 2020 Market Research - Persistence Persistence Market Research 1
Global Market Study on Chelated-Iron Agricultural Micronutrient - Latin America to Witness Highest Growth by 2020 Persistence Market Research Released New Market Report “Global Market Study on Chelated-Iron Agricultural Micronutrient: Latin America to Witness Highest Growth by 2020”, the global chelated-iron agricultural micronutrient market is expected to account for US$36.9 Mn by the end of 2015, and is anticipated to expand at a CAGR of 6.8% to reach US$51.4 Mn between 2015 end and 2020. Buy Full Report: http://www.persistencemarketresearch.com/market-research/chelated- iron-agricultural-micronutrient-market.asp Presently, the chelated iron agricultural micronutrient market is mainly driven by factors such as poor soil quality, increasing demand for quality food and government support to farmers in procuring high-grade fertilizers. However, factors such as high product price, fluctuating economic conditions and supply-demand disruptions are expected to restrain the growth of the market. Chelated iron agricultural micronutrient are those elements that are mixed with fertilizers to increase the minerals supplement in the soil as most soils in various parts of the world are being rapidly depleted of minerals. Companies are voluntarily fortifying fertilizers with chelated iron micronutrient to increase the productivity of crops. By Region, Asia Pacific (APAC) was the largest market for chelated iron micronutrient with 44.8% share of the overall market in 2014, followed by North America with 24.8%. Latin America is expected to exhibit highest CAGR of 8.9% during the forecast period, followed by MEA, which is expected to expand at a CAGR of 7.8%. APAC is forecast to remain the most significant market, with highest absolute $ opportunity. The global chelated iron agricultural micronutrient market is anticipated to expand at a CAGR of 6.8 % from 2015 to 2021, to reach US$51.4 Mn by 2020. In terms of volume, production of chelated iron agricultural micronutrient stood at 9,037.7 Kg in 2014 and is expected to reach 12,194.5 Kg by 2020, exhibiting a CAGR of 5.3%. Persistence Market Research 2
Global Market Study on Chelated-Iron Agricultural Micronutrient - Latin America to Witness Highest Growth by 2020 The market is segmented by crop type into cereals, pulses & oilseeds, fruits & vegetables and others. The others segment is expected to witness highest CAGR during the forecast period, with 9.3% in terms of value. However, the absolute $ opportunity growth is expected to be highest in the cereals segment, which is projected to exhibit a CAGR of 6.6%. Fruits and vegetable segment is expected to register second highest CAGR of 7.1% in terms of value and 5.5 in terms of volume. Request Sample Report: http://www.persistencemarketresearch.com/samples/6337 Key players in the global chelated iron agricultural micronutrients market that has been profiled in this report include Agrium Inc., Yara International Ltd., AkzoNobel, Compass Minerals International Inc., BASF SE, Monsanto Company, Bayer CropScience AG, ADAMA Agricultural Solutions Ltd., Land O’Lakes Inc., Nufarm Limited, Sumitomo Chemical Co., Ltd., Syngenta International AG, The Mosaic Company, ATP Nutrition, Basic or, L.C., Brandt Consolidated Inc., Grow More Inc., Kay-Flo, Micnelf USA Inc., Nutra-Flo Company (K- Flo), Stoller USA, Inc., Verdesian Life Sciences, LLC (QC Corporation) and DuPont. Market History: Chelated micronutrients are produced by altering positively charged cat-ions to negatively charged molecules. As soil itself is negatively charged, it repels negatively charged molecules of chelated micronutrients, making it easily available for uptake by plants.Chelated iron micronutrient is mostly used in calcareous (high pH) soils and soils low in organic matter.High intensive farming and modern fertilizers have caused depletion of various micronutrients from the soil, which are essential for healthy plant growth.Iron deficiency in plants causes chlorosis due to poor chlorophyll synthesis and also affects lignin formation, energy transfer and nitrogen reduction and fixation in plants. The global chelated iron micronutrient market was valued at around US$ 34.7 million in 2014. Asia Pacific (APAC)was the largest market for chelated iron micronutrient with44.8% share of the overall market in 2014, followed by North America with 24.8%.Latin America is expected to exhibit highest CAGR of 8.9% during the forecast period, followed by MEA, which is expected to expand at a CAGR of 7.8%. APAC is forecast to remain the most significant market, with highest absolute $ opportunity. Persistence Market Research 3
Global Market Study on Chelated-Iron Agricultural Micronutrient - Latin America to Witness Highest Growth by 2020 The world population is continuously increasing and the demand for quality food is increasing rapidly, especially in emerging markets as the purchasing power of buyers has grown significantly.Upgraded farming practices and government subsidies to waive the fertilizers price for farmers have generated a good demand for chelated iron micronutrient for crops like soybean, alfalfa and turf grass etc. Thus, the market for chelated iron micronutrient is expected to exhibit a robust growth in the coming years. The global chelated iron micronutrient market is expected to be valued atUS$ 51.4 million by the end of 2015, registering a CAGR of 6.8% between 2015 and 2020. In terms of volume, the market accounted for 9,037.7 Kg in 2014, which is expected to increase at a CAGR of 5.3% to reach 12,194.5 Kg by 2020. By crop type, cereals were the largest segment, valued at US$ 21,030 thousand in terms of revenue and 5,289 Kg in terms of volume. In the same year, fruits and vegetables were the second largest segment by crop type, accounting for around 28.0% and 30.6% share respectively of the market. Key market players in the chelated iron micronutrient marketincludeAgrium Inc., Yara International Ltd., AkzoNobel, BASF SE, Monsanto Company, Bayer CropScience and DuPont. Table of Content Table of Content 1. Executive Summary 2. Research Methodology 3. Assumptions & Acronyms 4. Market Overview 4.1. Micronutrient: Introduction 4.2. Global Chelated Iron - Agricultural Micronutrient 4.2.1. Market Value Volume Forecast 2013–2020 4.2.2. Market Volume Forecast 2013–2020 4.3. Market Taxonomy Persistence Market Research 4
Global Market Study on Chelated-Iron Agricultural Micronutrient - Latin America to Witness Highest Growth by 2020 5. Global Chelated Iron - Agricultural Micronutrient Market Dynamics 5.1. Drivers 5.2. Restraints 5.3. Trends 6. Global Chelated Iron - Agricultural Micronutrient Market Size and Forecast by Crop Type 6.1. Global Chelated Iron - Agricultural Micronutrient Market Value & Volume Forecast by Crop Type 6.1.1. Global Cereals Segment Market Value & Volume Forecast 2013–2020 6.1.2. Global Fruits and Vegetables Segment Value & Volume Forecast 2013–2020 6.1.3. Global Pulses & Oilseeds Segment Market Value & Volume Forecast 2013–2020 6.1.4. Global Others Segment Market Value & Volume Forecast 2013–2020 7. Global Chelated Iron - Agricultural Micronutrient Market Size and Forecast by Region 7.1. Global Chelated Iron - Agricultural Micronutrient Market Share and BPS Analysis 2014 & 2020 7.2. Global Chelated Iron - Agricultural Micronutrient Market Attractiveness Analysis by Region 7.3. Global Chelated Iron - Agricultural Micronutrient Market Snapshot by Region 7.3.1. Asia Pacific Market Value Forecast 2010–2020 7.3.2. North America Market Value Forecast 2010–2020 7.3.3. Europe Market Value Forecast 2010–2020 7.3.4. Latin America Market Value Forecast 2010–2020 7.3.5. Middle East and Africa Market Value Forecast 2010–2020 7.4. Pricing Analysis: Chelated Iron– Agricultural Micronutrient Market 8. North America Chelated Iron - Agricultural Micronutrient Market Size and Forecast by Country 8.1. North America Chelated Iron Micronutrient Market Value and Volume Forecast 2013– 2020 8.2. United States (U.S.) Market Analysis 8.2.1. U.S. Chelated Iron Micronutrient Market Value and Volume Forecast By Crop Type 8.2.1.1. Cereals Persistence Market Research 5
Global Market Study on Chelated-Iron Agricultural Micronutrient - Latin America to Witness Highest Growth by 2020 8.2.1.2. Pulses & Oilseeds 8.2.1.3. Fruits & Vegetables 8.2.1.4. Others 8.3. Canada Market Analysis 8.3.1. Canada Chelated Iron Micronutrient Market Value and Volume Forecast By Crop Type 8.3.1.1. Cereals 8.3.1.2. Pulses & Oilseeds 8.3.1.3. Fruits & Vegetables 8.3.1.4. Others 9. Latin America Chelated Iron - Agricultural Micronutrient Market Size and Forecast by Country 9.1. Latin America Chelated Iron Micronutrient Market Value and Volume Forecast 2013–2020 9.2. Brazil Market Analysis 9.2.1. Brazil Chelated Iron Micronutrient Market Value and Volume Forecast By Crop Type 9.2.1.1. Cereals 9.2.1.2. Pulses & Oilseeds 9.2.1.3. Fruits & Vegetables 9.2.1.4. Others 9.3. Mexico Market Analysis 9.3.1. Mexico Chelated Iron Micronutrient Market Value and Volume Forecast By Crop Type 9.3.1.1. Cereals 9.3.1.2. Pulses & Oilseeds 9.3.1.3. Fruits & Vegetables 9.3.1.4. Others 9.4. Argentina Market Analysis 9.4.1. Argentina Chelated Iron Micronutrient Market Value and Volume Forecast By Crop Type 9.4.1.1. Cereals 9.4.1.2. Pulses & Oilseeds 9.4.1.3. Fruits & Vegetables 9.4.1.4. Others 9.5. Rest of Latin America (RLATAM) Market Analysis 9.5.1. RLATAM Chelated Iron Micronutrient Market Value and Volume Forecast By Crop Type Persistence Market Research 6
Global Market Study on Chelated-Iron Agricultural Micronutrient - Latin America to Witness Highest Growth by 2020 9.5.1.1. Cereals 9.5.1.2. Pulses & Oilseeds 9.5.1.3. Fruits & Vegetables 9.5.1.4. Others 10. Europe Chelated Iron - Agricultural Micronutrient Market Size and Forecast 10.1. Europe Chelated Iron Micronutrient Market Value and Volume Forecast 2013–2020 10.2. France Market Analysis 10.2.1. France Chelated Iron Micronutrient Market Value and Volume Forecast By Crop Type 10.2.1.1. Cereals 10.2.1.2. Pulses & Oilseeds 10.2.1.3. Fruits & Vegetables 10.2.1.4. Others 10.3. Russia Market Analysis 10.3.1. Russia Chelated Iron Micronutrient Market Value and Volume Forecast By Crop Type 10.3.1.1. Cereals 10.3.1.2. Pulses & Oilseeds 10.3.1.3. Fruits & Vegetables 10.3.1.4. Others 10.4. Germany Market Analysis 10.4.1. Germany Chelated Iron Micronutrient Market Value and Volume Forecast By Crop Type 10.4.1.1. Cereals 10.4.1.2. Pulses & Oilseeds 10.4.1.3. Fruits & Vegetables 10.4.1.4. Others 10.5. Italy Market Analysis 10.5.1. Italy Chelated Iron Micronutrient Market Value and Volume Forecast By Crop Type 10.5.1.1. Cereals 10.5.1.2. Pulses & Oilseeds 10.5.1.3. Fruits & Vegetables 10.5.1.4. Others 10.6. Spain Market Analysis Persistence Market Research 7
Global Market Study on Chelated-Iron Agricultural Micronutrient - Latin America to Witness Highest Growth by 2020 10.6.1. Spain Chelated Iron Micronutrient Market Value and Volume Forecast By Crop Type 10.6.1.1. Cereals 10.6.1.2. Pulses & Oilseeds 10.6.1.3. Fruits & Vegetables 10.6.1.4. Others 10.7. United Kingdom (UK) Market Analysis 10.7.1. UK Chelated Iron Micronutrient Market Value and Volume Forecast By Crop Type 10.7.1.1. Cereals 10.7.1.2. Pulses & Oilseeds 10.7.1.3. Fruits & Vegetables 10.7.1.4. Others 10.8. Poland Market Analysis 10.8.1. Poland Chelated Iron Micronutrient Market Value and Volume Forecast By Crop Type 10.8.1.1. Cereals 10.8.1.2. Pulses & Oilseeds 10.8.1.3. Fruits & Vegetables 10.8.1.4. Others 10.9. Nordic Market Analysis 10.9.1. Nordic Chelated Iron Micronutrient Market Value and Volume Forecast By Crop Type 10.9.1.1. Cereals 10.9.1.2. Pulses & Oilseeds 10.9.1.3. Fruits & Vegetables 10.9.1.4. Others 10.10. BENELUX Market Analysis 10.10.1. BENELUX Chelated Iron Micronutrient Market Value and Volume Forecast By Crop Type 10.10.1.1. Cereals 10.10.1.2. Pulses & Oilseeds 10.10.1.3. Fruits & Vegetables 10.10.1.4. Others 10.11. Rest of Europe Market Analysis 10.11.1. Rest of Europe Chelated Iron Micronutrient Market Value and Volume Forecast By Crop Type 10.11.1.1. Cereals Persistence Market Research 8
Global Market Study on Chelated-Iron Agricultural Micronutrient - Latin America to Witness Highest Growth by 2020 10.11.1.2. Pulses & Oilseeds 10.11.1.3. Fruits & Vegetables 10.11.1.4. Others 11. Asia Pacific (APAC) Chelated Iron - Agricultural Micronutrient Market Size and Forecast by Country 11.1. APAC Chelated Iron Micronutrient Market Value and Volume Forecast 2013–2020 11.2. China Market Analysis 11.2.1. China Chelated Iron Micronutrient Market Value and Volume Forecast By Crop Type 11.2.1.1. Cereals 11.2.1.2. Pulses & Oilseeds 11.2.1.3. Fruits & Vegetables 11.2.1.4. Others 11.3. India Market Analysis 11.3.1. India Chelated Iron Micronutrient Market Value and Volume Forecast By Crop Type 11.3.1.1. Cereals 11.3.1.2. Pulses & Oilseeds 11.3.1.3. Fruits & Vegetables 11.3.1.4. Others 11.4. Japan Market Analysis 11.4.1. Japan Chelated Iron Micronutrient Market Value and Volume Forecast By Crop Type 11.4.1.1. Cereals 11.4.1.2. Pulses & Oilseeds 11.4.1.3. Fruits & Vegetables 11.4.1.4. Others 11.5. Australia and New Zealand (ANZ) Market Analysis 11.5.1. ANZ Chelated Iron Micronutrient Market Value and Volume Forecast By Crop Type 11.5.1.1. Cereals 11.5.1.2. Pulses & Oilseeds 11.5.1.3. Fruits & Vegetables 11.5.1.4. Others 11.6. Rest of APAC Market Analysis 11.6.1. Rest of APAC Chelated Iron Micronutrient Market Value and Volume Forecast By Crop Type 11.6.1.1. Cereals Persistence Market Research 9
Global Market Study on Chelated-Iron Agricultural Micronutrient - Latin America to Witness Highest Growth by 2020 11.6.1.2. Pulses & Oilseeds 11.6.1.3. Fruits & Vegetables 11.6.1.4. Others 12. Middle East and Africa (MEA) Chelated Iron - Agricultural Micronutrient Market Size and Forecast by Country 12.1. MEA Chelated Iron Micronutrient Market Value and Volume Forecast 2013–2020 12.2. Sub Saharan Market Analysis 12.2.1. Sub Saharan Africa Chelated Iron Micronutrient Market Value and Volume Forecast By Crop Type 12.2.1.1. Cereals 12.2.1.2. Pulses & Oilseeds 12.2.1.3. Fruits & Vegetables 12.2.1.4. Others 12.3. North Africa Market Analysis 12.3.1. North Africa Chelated Iron Micronutrient Market Value and Volume Forecast By Crop Type 12.3.1.1. Cereals 12.3.1.2. Pulses & Oilseeds 12.3.1.3. Fruits & Vegetables 12.3.1.4. Others 12.4. Turkey Market Analysis 12.4.1. Turkey Chelated Iron Micronutrient Market Value and Volume Forecast By Crop Type 12.4.1.1. Cereals 12.4.1.2. Pulses & Oilseeds 12.4.1.3. Fruits & Vegetables 12.4.1.4. Others 12.5. South Africa Market Analysis 12.5.1. South Africa Chelated Iron Micronutrient Market Value and Volume Forecast By Crop Type 12.5.1.1. Cereals 12.5.1.2. Pulses & Oilseeds 12.5.1.3. Fruits & Vegetables 12.5.1.4. Others Persistence Market Research 10
Global Market Study on Chelated-Iron Agricultural Micronutrient - Latin America to Witness Highest Growth by 2020 12.6. Gulf Co-operation Council (GCC) Market Analysis 12.6.1. GCC Chelated Iron Micronutrient Market Value and Volume Forecast By Crop Type 12.6.1.1. Cereals 12.6.1.2. Pulses & Oilseeds 12.6.1.3. Fruits & Vegetables 12.6.1.4. Others 12.7. Rest of MEA Market Analysis 12.7.1. Rest of MEA Chelated Iron Micronutrient Market Value and Volume Forecast By Crop Type 12.7.1.1. Cereals 12.7.1.2. Pulses & Oilseeds 12.7.1.3. Fruits & Vegetables 12.7.1.4. Others 13. Competitive Landscape of Agricultural Micronutrient Players 13.1. Competition Dashboard 13.1.1. Agricultural Micronutrient Producer 13.1.2. Chemical Reagent Provider 13.2. Company Profiles 13.2.1. Agricultural Micronutrient Producer 13.2.1.1. ADAMA Agricultural Solutions Ltd. 13.2.1.2. Agrium Inc. 13.2.1.3. Akzo Nobel N.V. 13.2.1.4. Auriga Industries A/S 13.2.1.5. BASF SE 13.2.1.6. Bayer CropScience AG 13.2.1.7. Compass Minerals International Inc. 13.2.1.8. E. I. DUPONT DE NEMOURS AND COMPANY 13.2.1.9. Land O’Lakes Inc. Monsanto Co. 13.2.1.10. Nufarm Limited 13.2.1.11. Sumitomo Chemical Co., Ltd 13.2.1.12. Syngenta International AG 13.2.1.13. The Dow Chemical Co. 13.2.1.14. The Mosaic Company 13.2.1.15. Yara International ASA Persistence Market Research 11
Global Market Study on Chelated-Iron Agricultural Micronutrient - Latin America to Witness Highest Growth by 2020 13.2.1.16. Private Companies 13.2.1.16.1. ATP Nutrition 13.2.1.16.2. Baicor, L.C. 13.2.1.16.3. Brandt Consolidated Inc. 13.2.1.16.4. Grow More Inc. 13.2.1.16.5. Kay-Flo 13.2.1.16.6. Micnelf USA Inc. 13.2.1.16.7. Nutra-Flo Company (K- Flo) 13.2.1.16.8. Stoller USA, Inc. 13.2.1.16.9. Verdesian Life Sciences, LLC (QC Corporation) 13.2.2. Chemical Reagent Provider 13.2.2.1. Merck KGaA 13.2.2.2. Sigma-Aldrich Corporation List of Table Table 1: Global Chelated-Iron Agricultural Micronutrient Market Snapshot, by Region, 2010– 2020 Table 2: North America Chelated Iron Micronutrient Market Size by Country, 2010–2020 (US$ Thousands) Table 3: U.S. Chelated Iron Micronutrient Market Value and Forecast, 2010–2020 (US$ Thousands) Table 4: U.S. Chelated Iron Micronutrient Market Volume and Forecast, 2010–2020 (Kg) Table 5: Canada Chelated Iron Micronutrient Market Value and Forecast, 2010–2020 (US$ Thousands) Table 6: Canada Chelated Iron Micronutrient Market Volume and Forecast, 2010–2020 (Kg) Table 7: Latin America Chelated Iron Micronutrient Market Size, by Country, 2010–2020 (US$ Thousands) Table 8: Brazil Chelated Iron Micronutrient Market Value and Forecast, 2010–2020 (US$ Thousands) Table 9: Brazil Chelated Iron Micronutrient Market Volume and Forecast, 2010–2020 (Kg) Table 10: Mexico Chelated Iron Micronutrient Market Value and Forecast, 2010–2020 (US$ Thousands) Table 11: Mexico Chelated Iron Micronutrient Market Volume and Forecast, 2010–2020 (Kg) Persistence Market Research 12
Global Market Study on Chelated-Iron Agricultural Micronutrient - Latin America to Witness Highest Growth by 2020 Table 12: Argentina Chelated Iron Micronutrient Market Value and Forecast, 2010–2020 (US$ Thousands) Table 13: Argentina Chelated Iron Micronutrient Market Volume and Forecast, 2010–2020 (Kg) Table 14: Rest of LATAM Chelated Iron Micronutrient Market Value and Forecast, 2010–2020 (US$ Thousands) Table 15: Rest of LATAM Chelated Iron Micronutrient Market Volume and Forecast, 2010–2020 (Kg) Table 16: Europe Chelated Iron Micronutrient Market Size, by Country, 2010–2020 (US$ Thousands) Table 17: France Chelated Iron Micronutrient Market Value and Forecast, 2010–2020 (US$ Thousands) Table 18: France Chelated Iron Micronutrient Market Volume and Forecast, 2010–2020 (Kg) Table 19: Russia Chelated Iron Micronutrient Market Value and Forecast, 2010–2020 (US$ Thousands) Table 20: Russia Chelated Iron Micronutrient Market Volume and Forecast, 2010–2020 (Kg) Table 21: Germany Chelated Iron Micronutrient Market Value and Forecast, 2010–2020 (US$ Thousands) Table 22: Germany Chelated Iron Micronutrient Market Volume and Forecast, 2010–2020 (Kg) Table 23: Italy Chelated Iron Micronutrient Market Value and Forecast, 2010–2020 (US$ Thousands) Table 24: Italy Chelated Iron Micronutrient Market Volume and Forecast, 2010–2020 (Kg) Table 25: Spain Chelated Iron Micronutrient Market Value and Forecast, 2010–2020 (US$ Thousands) Table 26: Spain Chelated Iron Micronutrient Market Volume and Forecast, 2010–2020 (Kg) Table 27: U.K. Chelated Iron Micronutrient Market Value and Forecast, 2010–2020 (US$ Thousands) Table 28: U.K. Chelated Iron Micronutrient Market Volume and Forecast, 2010–2020 (Kg) Table 29: Poland Chelated Iron Micronutrient Market Value and Forecast, 2010–2020 (US$ Thousands) Table 30: Poland Chelated Iron Micronutrient Market Volume and Forecast, 2010–2020 (Kg) Table 31: Nordic Chelated Iron Micronutrient Market Value and Forecast, 2010–2020 (US$ Thousands) Table 32: Nordic Chelated Iron Micronutrient Market Volume and Forecast, 2010–2020 (Kg) Persistence Market Research 13
Global Market Study on Chelated-Iron Agricultural Micronutrient - Latin America to Witness Highest Growth by 2020 Table 33: BENELUX Chelated Iron Micronutrient Market Value and Forecast, 2010–2020 (US$ Thousands) Table 34: BENELUX Chelated Iron Micronutrient Market Volume and Forecast, 2010–2020 (Kg) Table 35: Rest of Europe Chelated Iron Micronutrient Market Value and Forecast, 2010–2020 (US$ Thousands) Table 36: Rest of Europe Chelated Iron Micronutrient Market Volume and Forecast, 2010– 2020 (Kg) Table 37: Asia Pacific Chelated Iron Micronutrient Market Size, by Country, 2010–2020 (US$ Thousands) Table 38: China Chelated Iron Micronutrient Market Value and Forecast, 2010–2020 (US$ Thousands) Table 39: China Chelated Iron Micronutrient Market Volume and Forecast, 2010–2020 (Kg) Table 40: India Chelated Iron Micronutrient Market Value and Forecast, 2010–2020 (US$ Thousands) Table 41: India Chelated Iron Micronutrient Market Volume and Forecast, 2010–2020 (Kg) Table 42: Japan Chelated Iron Micronutrient Market Value and Forecast, 2010–2020 (US$ Thousands) Table 43: Japan Chelated Iron Micronutrient Market Volume and Forecast, 2010–2020 (Kg) Table 44: ANZ Chelated Iron Micronutrient Market Value and Forecast, 2010–2020 (US$ Thousands) Table 45: ANZ Chelated Iron Micronutrient Market Volume and Forecast, 2010–2020 (Kg) Table 46: Rest of APAC Chelated Iron Micronutrient Market Value and Forecast, 2010–2020 (US$ Thousands) Table 47: Rest of APAC Chelated Iron Micronutrient Market Volume and Forecast, 2010–2020 (Kg) Table 48: The Middle East & Africa Chelated Iron Micronutrient Market Size, by Country, 2010–2020 (US$ Thousands) Table 49: Sub-Saharan Africa Chelated Iron Micronutrient Market Value and Forecast, 2010– 2020 (US$ Thousands) Table 50: Sub-Saharan Africa Chelated Iron Micronutrient Market Volume and Forecast, 2010– 2020 (Kg) Table 51: North Africa Chelated Iron Micronutrient Market Value and Forecast, 2010–2020 (US$ Thousands) Table 52: North Africa Chelated Iron Micronutrient Market Volume and Forecast, 2010–2020 (Kg) Persistence Market Research 14
Global Market Study on Chelated-Iron Agricultural Micronutrient - Latin America to Witness Highest Growth by 2020 Table 53: Turkey Chelated Iron Micronutrient Market Value and Forecast, 2010–2020 (US$ Thousands) Table 54: Turkey Chelated Iron Micronutrient Market Volume and Forecast, 2010–2020 (Kg) Table 55: South Africa Chelated Iron Micronutrient Market Value and Forecast, 2010–2020 (US$ Thousands) Table 56: South Africa Chelated Iron Micronutrient Market Volume and Forecast, 2010–2020 (Kg) Table 57: GCC Chelated Iron Micronutrient Market Value and Forecast, 2010–2020 (US$ Thousands) Table 58: GCC Chelated Iron Micronutrient Market Volume and Forecast, 2010–2020 (Kg) Table 59: Rest of MEA Chelated Iron Micronutrient Market Value and Forecast, 2010–2020 (US$ Thousands) Table 60: Rest of MEA Chelated Iron Micronutrient Market Volume and Forecast, 2010–2020 (Kg) List of Figure Figure1: Global Chelated Iron - Agricultural Micronutrient Market Value (US$ Thousand) & Volume (Kg) Forecast, 2013–2020 Figure2: Global Chelated Iron - Agricultural Micronutrient Market Volume (Kg), 2014 & 2020 Figure3: Global Chelated Iron - Agricultural Micronutrient Market Value (US$ Thousand), 2014 & 2020 Figure 4: Cereals Market Value (US$ Thousand) and Volume (Kg) Forecast, 2013−2020 Figure 5: Fruits and Vegetables Market Value (US$ Thousand) and Volume (Kg) Forecast, 2013−2020 Figure 6: Pulses & Oilseeds Market Value (US$ Thousand) and Volume (Kg) Forecast, 2013−2020 Figure 7: Others Market Value (US$ Thousand) and Volume (Kg) Forecast, 2013−2020 Figure 8: Chelated Iron - Agricultural Micronutrient BPS Analysis by Region, 2014 & 2020 Figure 9: Chelated Iron - Agricultural Micronutrient Attractiveness Index by Region, 2014 Figure 10: North America Chelated Iron - Agricultural Micronutrient Market Value (US$ Thousand) & Volume (Kg), 2013–2020 Figure 11: North America Chelated Iron - Agricultural Micronutrient Market Value, by Country, 2014 Figure 12: Latin America Chelated Iron - Agricultural Micronutrient Market Value (US$ Thousand) & Volume (Kg), 2013–2020 Persistence Market Research 15
Global Market Study on Chelated-Iron Agricultural Micronutrient - Latin America to Witness Highest Growth by 2020 Figure 13: Latin America Chelated Iron - Agricultural Micronutrient Market Value, by Country, 2014 Figure 14: Europe Chelated Iron - Agricultural Micronutrient Market Value (US$ Thousand) & Volume (Kg), 2013–2020 Figure 15: Europe Chelated Iron - Agricultural Micronutrient Market, by Country, 2014 Figure 16: Asia Pacific Chelated Iron - Agricultural Micronutrient Market Value (US$ Thousand) & Volume (Kg), 2013–2020 Figure 17: Asia Pacific Chelated Iron - Agricultural Micronutrient Market by Country, 2014 Figure 18: MEA Chelated Iron - Agricultural Micronutrient Market Value (US$ Thousand) & Volume (Kg), 2013–2020 Figure 19: MEA Chelated Iron - Agricultural Micronutrient Market, by Country, 2014 About Us: Persistence Market Research is a global market research firm specializing- syndicated research, custom research, and consulting services At Persistence Market Research (PMR), we are in the business of accelerating your business. As a full- service market research firm, we stand committed to bringing more accuracy and speed to your business decisions. From ready-to-purchase market research reports to customized global research solutions, our engagement models are highly flexible without compromising on our deep-seated research values. Briefly stated, our mission is to give you access to forecasts and trends analyses that put you on the path to profitability. PMR’s Services Go Beyond Gleaning Data Most enterprises believe that IT and databases are enough to make an accurate decision. While we do not dispute that, consider this: How long does it take to make an accurate and strategic million-dollar decision? We strive to deliver both even with demanding deadlines. Persistence Market Research 16
Global Market Study on Chelated-Iron Agricultural Micronutrient - Latin America to Witness Highest Growth by 2020 Contact Us: Addie Thomes 305 Broadway 7th Floor, New York City, NY 10007, United States, USA - Canada Toll Free: 800-961-0353 Email: sales@persistencemarketresearch.com Web: http://www.persistencemarketresearch.com Persistence Market Research 17