Download
1 / 13
130 likes | 225 Vues
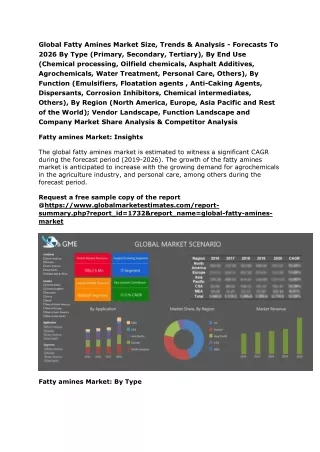
The fatty acids supplements market is bifurcated into the source (marine oils, algal oils, and others) and application (dietary supplements, functional food and beverages, and others). The marine oils segment held the largest share of the overall market in 2013 at 102.7 million tons; and is expected to reach 235.4 million tons by 2020, at a CAGR of 12.7% for the period 2014 – 2020.

E N D
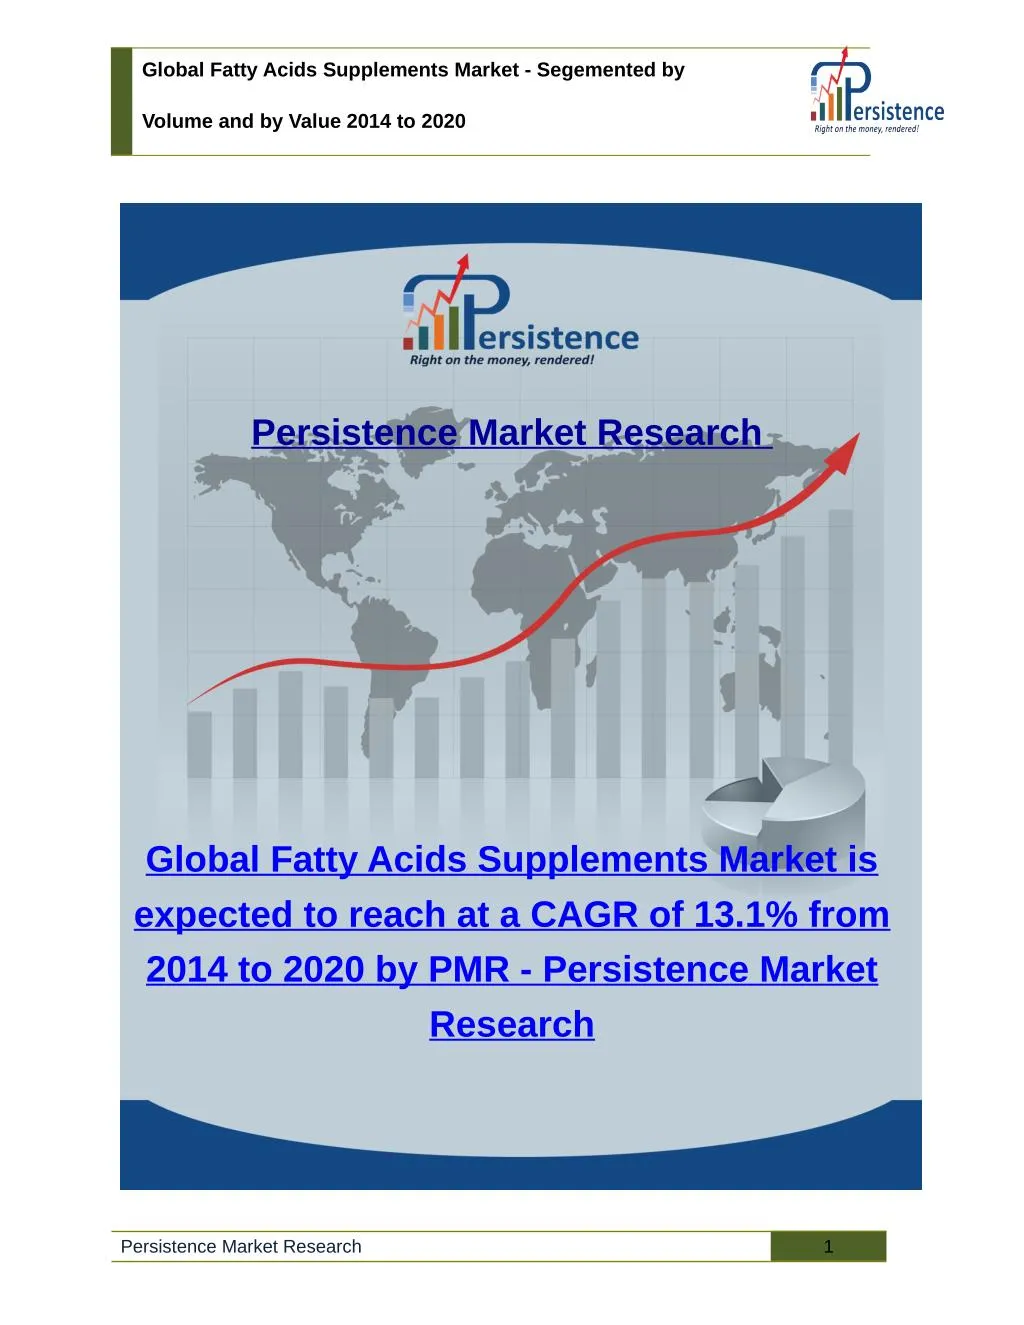
Global Fatty Acids Supplements Market - Segemented by Volume and by Value 2014 to 2020 Persistence Market Research Global Fatty Acids Supplements Market is expected to reach at a CAGR of 13.1% from 2014 to 2020 by PMR - Persistence Market Research Persistence Market Research 1
Global Fatty Acids Supplements Market - Segemented by Volume and by Value 2014 to 2020 Persistence Market Research Released New Market Report “The Global Market Study on Fatty Acids Supplements: Marine Oil Segment to Witness Highest Growth by 2020,” the global Fatty Acids Supplements market was valued at USD 1,912.0 million in 2013 and is expected to grow at a CAGR of 13.1% from 2014 to 2020, to reach an estimated value of USD 4,477.8 million by 2020. View Full Report with TOC: http://www.persistencemarketresearch.com/toc/2802 Increasing awareness among consumers about health, diet, and fitness has helped improve lifestyles greatly. In the recent years, consumers have become more conscious of their diet intake. Fatty acids such as omega-3 offer various health benefits. Omega-3 fatty acids comprise of acidic contents such as Eicosapentaenoic acid (EPA), docosahexaenoic acid (DHA) and alpha-linolenic acid (ALA). These acids are required for regular metabolic activities as the human body cannot synthesize these acids on its own. Omega-3 EPA/DHA content has the ability to reduce the level of unwanted cholesterol in the human body, thereby lowering the risk of coronary heart diseases and blood pressure disorders. Urban populations are more concerned about their lifestyle compared to rural populations. The lifestyle of the urban population is fast paced. Fast-paced lifestyle along with an aspiration to stay fit attracts people to omega-3 fatty acids. According to the United Nations, the urban population is expected to increase from 3.4 billion in 2009 to 6.3 billion in 2050. With urbanization increasing worldwide, this trend is expected to continue for a long period. Increasing health awareness and medicinal benefits of fatty acids are major growth drivers for the global fatty acids supplements market. In addition, increasing baby boomers population is expected to drive the global fatty acids supplements market. According to the Population Division of the United Nations Department of Economic and Social Affairs (UN- DESA), there were 841 million people aged 60 and above in 2013 compared to 205 million in 1950. The number is projected to reach over 2 billion by 2050. North America is the largest market for fatty acids supplements globally. A major factor contributing to the growth of the omega-3 market in Europe is the increasing level of awareness about omega-3 fatty acids. Asia-Pacific is the fastest growing and emerging market for omega-3. Countries such as India and China have high birth rates, which may Persistence Market Research 2
Global Fatty Acids Supplements Market - Segemented by Volume and by Value 2014 to 2020 boost the demand for omega-3 ingredients in infant formula. Birth rate is maximum in India, around 22%, followed by China at 12% in the Asia Pacific region. Request Sample Report: http://www.persistencemarketresearch.com/samples/2802 The fatty acids supplements market is bifurcated into source (marine oils, algal oils, and others) by value (USD million) and by volume (million tons), application (dietary supplements, functional food and beverages, and others) by value (USD million) and by volume (million tons), and region (North America, Europe, Asia-Pacific, and rest of the world). In terms of value, the global fatty acids supplements market grew from USD 1,430.0 million in 2010 to USD 1,912.0 million in 2013 at a CAGR of 10.2%. In terms of volume, the global fatty acids supplements market grew from 88.5 million tons in 2010 to 119.4 million tons in 2013 at a CAGR of 10.5%. Browse Full Report: http://www.persistencemarketresearch.com/market-research/fatty-acids- supplements-market.asp Among the regional segments, the North American fatty acids supplements market (largest market in 2013) increased by 9.2% CAGR during 2010 – 2013 to reach USD 688.3 million in 2013. The global fatty acids supplements market is highly consolidated, with the top five companies holding 75% market share. DSM leads the market, followed by Epax AS and Croda Health Care. Fatty Acids Supplements Market, by Source Marine oil • Algal oil • Others (including flaxseed oil) • Persistence Market Research 3
Global Fatty Acids Supplements Market - Segemented by Volume and by Value 2014 to 2020 Fatty Acids Supplements Market, by Application Dietary supplements • Functional food and beverages • Others (including pharmaceuticals and infant formula) • Fatty Acids Supplements Market, by Region North America • Europe • Asia Pacific • Rest of the World • Market History: Increasing health awareness and medicinal benefits of fatty acids are major growth drivers for the global fatty acids market. In the last few years, certain health organizations found omega series fatty acids can aid the treatment of eye, hair, and heart diseases. Increasing consumer base and technology advancement in controlling oxidation (to maintain the quality, taste, and smell of food) in omega-3, omega-6, and omega-9 for improved taste are also expected to drive the demand for fatty acids supplements. Increasing baby boomers population is expected to drive the global fatty acids supplements market. According to the Population Division of the United Nations Department of Economic and Social Affairs (UN- DESA), there were 841 million people aged 60 and above in 2013 compared to 205 million in 1950. The number is projected to reach over 2 billion by 2050. North America is the largest market for fatty acids supplements globally. In 2013, it contributed to around 35% of the global consumption of omega 3 fatty acids. A major factor contributing to the growth of the omega-3 market in Europe is the increasing level of awareness about omega-3 in the region. In the recent years, consumers have become more conscious of their diet intake. Asia-Pacific is the fastest growing and emerging market for omega-3. Countries such as India and China have high birth rates, which may boost the demand for omega-3 ingredients in infant formula. The birth rate is maximum in India Persistence Market Research 4
Global Fatty Acids Supplements Market - Segemented by Volume and by Value 2014 to 2020 (around 22%), followed by China 12%, in the Asia Pacific region. Omega-3 fats are useful for improving vision and aiding cognitive development in infants. Increasing population and growing urbanization in China has led to the multifold growth of the fatty acids supplements market. The fatty acids supplements market is bifurcated into the source (marine oils, algal oils, and others) and application (dietary supplements, functional food and beverages, and others). The marine oils segment held the largest share of the overall market in 2013 at 102.7 million tons; and is expected to reach 235.4 million tons by 2020, at a CAGR of 12.7% for the period 2014 – 2020. Among the application segments, the dietary supplements sector ( a largest sector in 2013) increased by 8.5% CAGR during 2010 – 2013 to reach USD 1,204.5 million in 2013. Among the regional segments, the North American fatty acids supplements market (largest market in 2013) increased by 9.2% CAGR during 2010 – 2013 to reach USD 688.3 million in 2013. The global fatty acids supplements market is highly consolidated, with the top five companies holding around 75% market share. DSM leads the market, followed by Epax AS and Croda Health Care. Persistence Market Research 5
Global Fatty Acids Supplements Market - Segemented by Volume and by Value 2014 to 2020 Persistence Market Research 6
Global Fatty Acids Supplements Market - Segemented by Volume and by Value 2014 to 2020 Table of Content Chapter 1 Preface 1.1 Report Description 1.1.1 Segments covered in the report 1.2 Research Methodology Chapter 2 Market Synopsis Chapter 3 Porter’s Five Forces Model 3.1 Bargaining Power of Suppliers 3.2 Bargaining Power of Buyers 3.3 Threat of New Entrants 3.4 Threat of Substitutes 3.5 Rivalry Among Competitors Chapter 4 Industry Overview 4.1 Introduction 4.2 Market Drivers 4.2.1 Healthy lifestyle 4.2.2 Technology advancements 4.2.3 Infant formula 4.2.4 Rising aging population 4.2.5 Impact analysis of market drivers 4.3 Market Restraints 4.3.1 Lack of awareness 4.3.2 Impact analysis of market restraints 4.4 Opportunities 4.4.1 High birth rate nations 4.5 Challenges 4.5.1 Decreasing phytoplanktons Chapter 5 Market Size and Forecast by Source 5.1 Marine Oils 5.2 Algal Oil Persistence Market Research 7
Global Fatty Acids Supplements Market - Segemented by Volume and by Value 2014 to 2020 5.3 Others (including Flaxseed) Chapter 6 Market Size and Forecast by Application 6.1 Dietary Supplements 6.2 Functional Food and Beverages 6.3 Others (including Pharmaceuticals and Infant Formula) Chapter 7 Market Size and Forecast by Geography 7.1 North America 7.2 Europe 7.3 Asia Pacific Chapter 8 Omega-6 and Omega-9 Fatty Acids, Overview 8.1 Omega-6 8.1.1 Health benefits of omega-6 8.1.2 Sources 8.1.2.1 Sunflower oil 8.1.2.2 Soybean oil 8.1.2.3 Palm oil 8.2 Omega-9 8.2.1 Health benefits of omega-9 8.2.2 Sources Chapter 9 Competitive Scenario 9.1 Global Fatty Acids Supplements Market Share, by Company Chapter 10 Company Profiles 10.1 Epax AS 10.1.1 Company overview 10.1.2 Products and services 10.1.3 Financial performance 10.1.4 Recent developments 10.2 Arista Industries, Inc. 10.2.1 Company overview 10.2.2 Products and services Persistence Market Research 8
Global Fatty Acids Supplements Market - Segemented by Volume and by Value 2014 to 2020 10.2.3 Financial performance 10.2.4 Recent developments 10.3 Omega Protein Corporation 10.3.1 Company overview 10.3.2 Products and services 10.3.3 Financial performance 10.3.4 Recent developments 10.4 Axellus AS 10.4.1 Company overview 10.4.2 Products and services 10.4.3 Financial performance 10.4.4 Recent developments 10.5 Copeinca AS 10.5.1 Company overview 10.5.2 Products and services 10.5.3 Financial performance 10.5.4 Recent developments 10.6 Croda Health Care 10.6.1 Company overview 10.6.2 Products and services 10.6.3 Financial performance 10.6.4 Recent developments 10.7 Koninklijke DSM N.V. 10.7.1 Company overview 10.7.2 Products and services 10.7.3 Financial performance 10.7.4 Recent developments Persistence Market Research 9
Global Fatty Acids Supplements Market - Segemented by Volume and by Value 2014 to 2020 List of Tables TABLE 1 Global fatty acids supplements market snapshot, by value, 2014 and 2020 TABLE 2 Global fatty acids supplements market snapshot, by volume, 2014 and 2020 TABLE 3 Impact analysis of market drivers TABLE 4 Impact analysis of market restraints TABLE 5 Global fatty acids supplements market, by source, 2010 – 2013 (million tons) TABLE 6 Global fatty acids supplements market, by source, 2014 – 2020 (million tons) TABLE 7 Global fatty acids supplements market, by source, 2010 – 2013 (USD million) TABLE 8 Global fatty acids supplements market, by source, 2014 – 2020 (USD million) TABLE 9 Marine oils fatty acids supplements market, by geography, 2010 – 2013 (million tons) TABLE 10 Marine oils fatty acids supplements market, by geography, 2014 – 2020 (million tons) TABLE 11 Marine oils fatty acids supplements market, by geography, 2010 – 2013 (USD million) TABLE 12 Marine oils fatty acids supplements market, by geography, 2014 – 2020 (USD million) TABLE 13 Algal oil fatty acids supplements market, by geography, 2010 – 2013 (million tons) TABLE 14 Algal oil fatty acids supplements market, by geography, 2014 – 2020 (million tons) TABLE 15 Algal oil fatty acids supplements market, by geography, 2010 – 2013 (USD million) TABLE 16 Algal oil fatty acids supplements market, by geography, 2014 – 2020 (USD million) TABLE 17 Others (including flaxseed) fatty acids supplements market, by geography, 2010 – 2013 (million tons) TABLE 18 Others (including flaxseed) fatty acids supplements market, by geography, 2014 – 2020 (million tons) TABLE 19 Others (including flaxseed) fatty acids supplements market, by geography, 2010 – 2013 (USD million) TABLE 20 Others (including flaxseed) fatty acids supplements market, by geography, 2014 – 2020 (USD million) TABLE 21 Global fatty acids supplements market, by application, 2010 – 2013 (million tons) TABLE 22 Global fatty acids supplements market, by application, 2014 – 2020 (million tons) TABLE 23 Global fatty acids supplements market, by application, 2010 – 2013 (USD million) TABLE 24 Global fatty acids supplements market, by application, 2014 – 2020 (USD million) TABLE 25 Dietary supplements market, by geography, 2010 – 2013 (million tons) Persistence Market Research 10
Global Fatty Acids Supplements Market - Segemented by Volume and by Value 2014 to 2020 TABLE 26 Dietary supplements market, by geography, 2014 – 2020 (million tons) TABLE 27 Dietary supplements market, by geography, 2010 – 2013 (USD million) TABLE 28 Dietary supplements market, by geography, 2014 – 2020 (USD million) TABLE 29 Functional food and beverages market, by geography, 2010 – 2013 (million tons) TABLE 30 Functional food and beverages market, by geography, 2014 – 2020 (million tons) TABLE 31 Functional food and beverages market, by geography, 2010 – 2013 (USD million) TABLE 32 Functional food and beverages market, by geography, 2014 – 2020 (USD million) TABLE 33 Others (including pharmaceuticals and infant formula) market, by geography, 2010 – 2013 (million tons) TABLE 34 Others (including pharmaceuticals and infant formula) market, by geography, 2014 – 2020 (million tons) TABLE 35 Others (including pharmaceuticals and infant formula) market, by geography, 2010 – 2013 (USD million) TABLE 36 Others (including pharmaceuticals and infant formula) market, by geography, 2014 – 2020 (USD million) TABLE 37 Global fatty acids supplements market size, by region, 2010 – 2013 (million tons) TABLE 38 Global fatty acids supplements market size, by region, 2014 – 2020 (million tons) TABLE 39 Global fatty acids supplements market size, by region, 2010 – 2013 (USD million) TABLE 40 Global fatty acids supplements market size, by region, 2014 – 2020 (USD million) TABLE 41 North America fatty acids supplements market, by source, 2010 – 2013 (million tons) TABLE 42 North America fatty acids supplements market, by source, 2014 – 2020 (million tons) TABLE 43 North America fatty acids supplements market, by source, 2010 – 2013 (USD million) TABLE 44 North America fatty acids supplements market, by source, 2014 – 2020 (USD million) TABLE 45 North America fatty acids supplements market, by application, 2010 – 2013 (million tons) TABLE 46 North America fatty acids supplements market, by application, 2014 – 2020 (million tons) TABLE 47 North America fatty acids supplements market, by application, 2010 – 2013 (USD million) TABLE 48 North America fatty acids supplements market, by application, 2014 – 2020 (USD million) Persistence Market Research 11
Global Fatty Acids Supplements Market - Segemented by Volume and by Value 2014 to 2020 TABLE 49 Europe Fatty acids supplements market, by source, 2010 – 2013 (million tons) TABLE 50 Europe fatty acids supplements market, by source, 2014 – 2020 (million tons) TABLE 51 Europe fatty acids supplements market, by source, 2010 – 2013 (USD million) TABLE 52 Europe fatty acids supplements market, by source, 2014 – 2020 (USD million) TABLE 53 Europe fatty acids supplements market, by application, 2010 – 2013 (million tons) TABLE 54 Europe fatty acids supplements market, by application, 2014 – 2020 (million tons) TABLE 55 Europe fatty acids supplements market, by application, 2010 – 2013 (USD million) TABLE 56 Europe fatty acids supplements market, by application, 2014 – 2020 (USD million) TABLE 57 Asia Pacific fatty acids supplements market, by source, 2010 – 2013 (million tons) TABLE 58 Asia Pacific fatty acids supplements market, by source, 2014 – 2020 (million tons) TABLE 59 Asia Pacific fatty acids supplements market, by source, 2010 – 2013 (USD million) TABLE 60 Asia Pacific fatty acids supplements market, by source, 2014 – 2020 (USD million) TABLE 61 Asia Pacific fatty acids supplements market, by application, 2010 – 2013 (million tons) TABLE 62 Asia Pacific fatty acids supplements market, by application, 2014 – 2020 (million tons) TABLE 63 Asia Pacific fatty acids supplements market, by application, 2010 – 2013 (USD million) TABLE 64 Asia Pacific fatty acids supplements market, by application, 2014 – 2020 (USD million) TABLE 65 Product line of Epax AS TABLE 66 Arista Industries, Inc. product line TABLE 67 Products and segments of Omega Protein Corporation TABLE 68 Product line of Axellus AS TABLE 69 Product line of Croda Health Care TABLE 70 Products and product classifications of DSM List of Figures FIG. 1 Global fatty acids supplements market, 2010 – 2020 (USD million) FIG. 2 Fatty acids supplement: Porter’s five forces analysis FIG. 3 Global birth rate, 2012 FIG. 4 Global sunflower oil production, 2008 – 2012 (million metric tons) FIG. 5 Global soybean oil production, 2008 – 2012 (million metric tons) FIG. 6 Global palm oil production, 2008 – 2012 (million metric tons) Persistence Market Research 12
Global Fatty Acids Supplements Market - Segemented by Volume and by Value 2014 to 2020 FIG. 7 Global fatty acids supplements market share, by company, 2013 FIG. 8 Omega Protein Corporation’s net sales and net profit, 2011 – 2013 (USD million) FIG. 9 Orkla Home & Personal’s net sales and net profit, 2011 – 2013 (USD million) FIG. 10 Croda International Plc’s net sales and net profit, 2011 – 2013 (USD million) FIG. 11 Koninklijke DSM N.V.’s net sales and profit, 2011 – 2013 (USD million) About Us: Persistence Market Research (PMR) is a full-service market intelligence firm specializing in syndicated research, custom research, and consulting services. PMR boasts market research expertise across the Healthcare, Chemicals and Materials, Technology and Media, Energy and Mining, Food and Beverages, Semiconductor and Electronics, Consumer Goods, and Shipping and Transportation industries. The company draws from its multi-disciplinary capabilities and high-pedigree team of analysts to share data that precisely corresponds to clients’ business needs. PMR stands committed to bringing more accuracy and speed to clients’ business decisions. From ready-to-purchase market research reports to customized research solutions, PMR’s engagement models are highly flexible without compromising on its deep-seated research values. Contact Us: Persistence Market Research 305 Broadway 7th Floor, New York City, NY 10007, United States, USA - Canada Toll Free: 800-961-0353 Email: sales@persistencemarketresearch.com Web: http://www.persistencemarketresearch.com Persistence Market Research 13