Download
1 / 52
530 likes | 685 Vues
Clawing Back Executive Compensation. James Ang Yingmei Cheng Sarah Fulmer. Source: Frydman and Jenter (2010) CEO Compensation, Working paper. Agency Problem. Incentive compensation aligns management interest with shareholders – Mehran (1995); Jensen and Murphy (1990)

E N D
Clawing Back Executive Compensation James Ang Yingmei Cheng Sarah Fulmer
Source: Frydman and Jenter (2010) CEO Compensation, Working paper
Agency Problem • Incentive compensation aligns management interest with shareholders – Mehran (1995); Jensen and Murphy (1990) • Incentive compensation, particularly stock options, encourages management to manipulate earnings – Klinger et al. (2002)
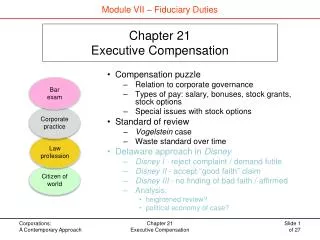
Solutions to Agency Problem • Monitoring by the Board of Directors • The greater the CEO power, the less effective the Board monitoring – Hermalin and Weisbach (1998) • Board monitoring weakens over the CEO’s tenure – Ryan et al. (2009) • Directors have an incentive to appease management – Bebchuck and Fried (2003) • Shareholder Activism / Shareholder Litigation • Shareholder activism is generally ineffective in changing corporate policy – Romano (2003); Klein and Zur (2009); Admati and Pfleiderer (2009) • Government Intervention / Clawback Provisions • SOX Section 304 • Dodd-Frank Section 954
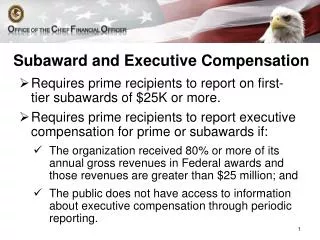
Overview of Clawbacks • Contractual or Statutory provision that allows a firm to recover fraudulently or erroneously paid compensation • SOX 304 • requires “misconduct” to trigger clawback • ALL incentive compensation AND profits from the sale of stock and options for 12 months following misstatement • Dodd-Frank 954 • All exchange-listed firms must adopt Clawback Policies • Applies to all “material” restatements (does not require misconduct) • Only recovers “excess” incentive compensation • Does not apply to recover profits from sale of stock and options
Incentives to Manipulate • Earnings manipulation is more prevalent where CEOs are “incentivized” – Bergstresserand Philippon (2006) • Executives exercise “unusually large” amount of options and sell large amounts of stock during periods of misreporting – Erickson et al. (2006) • Executives manipulate earnings to maintain stock prices or to prevent price decreases – Efendi et al. (2007); Johnson et al. (2008). • Executives manipulate: (a) to prevent decline in earnings; (b) to avoid missing analyst forecasts; and (c) to avoid reporting negative earnings – Burgstahler and Dichev (1997) • CEOs at poorly performing firms are more likely to be terminated – Warner et al. (1988); Arthuad-Day et al. (2006)
Hypothesis Development • H1: The amount recoverable under Dodd-Frank will not be economically significant • H2: CEOs manipulate earnings to profit from stock sales and option exercises • H3: CEOs manipulate earnings to avoid termination
Current Incentive Compensation • Firms engage in more manipulation where executives are “incentivized” – Bergstresserand Philippon (2006) • The more Equity / Total Compensation, the greater probability of accounting fraud – Erickson et al. (2006)
Enforcement of Clawbacks • Firms that voluntarily adopt clawback provisions have better financial reporting quality (deHaan et al., 2012) and lower probability of future restatement (Chan er al., 2011; Chen et al., 2012) • No evidence of enforcement, even in firms that voluntarily adopt clawback provision- Addy et al. (2011); Babenko et al. (2012)
Hypothesis Development • H1: The amount recoverable under Dodd-Frank will not be economically significant • H2: CEOs manipulate earnings to profit from stock sales and option exercises • H3: CEOs manipulate earnings to avoid termination
Stock and Option Profits • Insiders sell more stock during misreported period – Summers and Sweeney (1998); Beneish (1999); Beneish and Vargus (2002); Agrawal and Cooper (2006) • CEOs exercise more options during misreported periods – Kediaand Philippon (2009); Burns and Kedia (2008); Efendi et al. (2007) • Greater earnings management in years the CEO exercises options – Bergstressor and Philippon (2006)
Hypothesis Development • H1: The amount recoverable under Dodd-Frank will not be economically significant • H2: CEOs realize economically significant indirect gains from the sale of previously awarded stock and option grants • H3: CEOs receive indirect benefits from manipulating earnings by reducing their risk of being terminated
Probability of Termination • CEO turnover increases following poor firms performance – Huson et al. (2001) • CEOs who fail to meet analysts expectations face a higher risk of termination – Farrell and Whidbee (2003) • 51% of CEOs are terminated within two years following a restatement – Desai et al. (2006) • 93% of executives are terminated following SEC investigations for fraud – Karpoff et al. (2008)
Summary of Results • H1: Effectiveness of Dodd-Frank • Can recover something from 93% of the CEOs • Potential to recover 73% of Direct Gains (i.e. “excess incentive compensation”) • Economically small amount – average dollar amount recoverable $153,00 per CEO, per fiscal year • The remaining 27% of Direct Gains are paid more than three years prior to restatement; thus are unreachable under Dodd-Frank • Capture less than 1% of total gain from manipulation (Direct and Indirect Gains)
Summary of Results • H2: Gains from Insider Trading • Average CEO earns $3.7 million in stock gain and $3.8 million in option gains (per CEO, per year) • Average CEO profits by nearly $18 million during the misreported period • H3: Probability of Termination • 18% of the sample are able to reduce their probability of termination by at least 10% • 11% of the sample are able to reduce their probability of termination by at least 50% as result of inflation. • Thus “survival” is a credible motive.
Data • Compensation Data – Execucomp • Financial Data – 10-k Reports (SEC EDGAR) • Termination Data – Lexis-Nexis Searches • Parrino (1997) Methodology • Stock and Option Data – Thomson Reuter’s Insider Filing Database
Results • Effectiveness of Dodd-Frank • Direct Gains (i.e. “Excess Incentive Compensation”) • Stock and Option Gains • Probability of Termination
Direct Gains • CEOs are rewarded for positive performance and shielded from negative performance – Gaver and Gaver (1998) • Examine positive and negative performance variables separately Cash Incentive = α + β1Log(Assets) + β2NI_Pos + β3NI_Neg + ε Equity Incentive = α + β1Log(Assets) + β2Ret_Pos + β3Ret_Neg + ε
Direct Gains • Dodd-Frank Section 954: “in excess of what would have been paid to the executive officer under the accounting restatement” • Direct Gain (i.e. “Excess Incentive Comp.”) = UnrestatedCompensation – Restated Compensation • Methodology: Apply regression coefficients to estimate “Unrestated” Compensation and “Restated” Compensation • “Restated” stock returns based on what price would have been absent manipulation • Johnson et al. (2008) find stock prices drop 14.9% upon disclosure of fraud; • Desai et al. (2006); Palmrose (2004); Kediaand Philippon (2009) find 3-day market returns of -10% to -11% upon restatement announcement; • Burk (2010) finds 1-day decline of 5.5%. • Lower Bound = 5%; Upper Bound = 15%
Direct Gains • Methodology: Apply regression coefficients to estimate (1) “Unrestated” Compensation and (2) “Restated” Compensation “Direct Cash Gain” = Cash-Based IncentiveUnrestated – Cash-Based IncentiveRestated α + β1Log(Assets) + [β2NIU_Pos + β3NIU_Neg] – [β2NIR_Pos + β3NIR_Neg] + ε “Direct Equity Gain” = Equity-Based IncentiveUnrestated– Equity-Based IncentiveRestated α + β1Log(Assets) + [β2RetU_Pos + β3RetU_Neg] – [β2RetR_Pos + β3RetR_Neg] + ε
Current Incentive Compensation • SOX Section 304: • “any bonus or other incentive-based or equity-based • compensation . . . and any profits realized from the sale • of securities”
Results • Effectiveness of Dodd-Frank • Excess Incentive Compensation • Stock and Option Gains (Indirect Gains) • Probability of Termination
Stock and Option Profits • Methodology: • Collect insider trading from Thomson Reuters • Insider transactions for 217 firm-year observations: • 175 stock gains (98 CEOs) • 158 option gain(93 CEOs) Stock Gain = (Price Paid – Basis) x Shares Option Gain = (Market Price – Exercise Price) x Options
Dodd-Frank Clawback Recovery Under Clawback Provisions Dodd-Frank Sarbanes Oxley $64.6 million $1.19 billion of $4.4 billion Total Gains (Direct and Indirect)
Results • Effectiveness of Dodd-Frank • Excess Incentive Compensation • Stock and Option Gains • Probability of Termination
Fired = α + β1Log(Assets) + β2Tenure + β3NI + β4Neg_NI + β5NI_Down + β6Loss2 + ε • Fired = • Neg_NI = • NI_Down = • Loss2 = 1 if CEO fired (involuntary turnover) 0 otherwise (no turnover or voluntary) 1 if net income is negative 0 otherwise 1 if net income decreased from prior year 0 otherwise 1 if net income is negative for prior two years 0 otherwise
ΔProb = ProbUnrestated – ProbRestated ProbRestated ΔProb < -12.763% “Termination Avoidance CEOs”
Probability of Termination • Gain from Delayed Termination: (ΔTerminationRisk for CEOk) x (CEOk Compt-1) x (Number of Years) • Averagegain of $22.47 million (per CEO) • Aggregate gain of $1.55 billion (aggregate)
Robustness • Post-Dodd-Frank Period • NEED TO ADD NOTES