Download
1 / 25
250 likes | 423 Vues
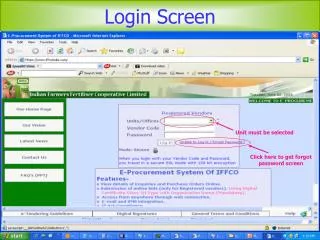
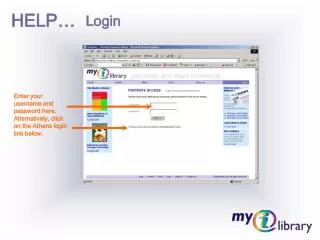
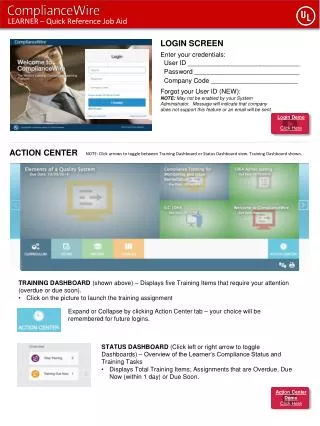
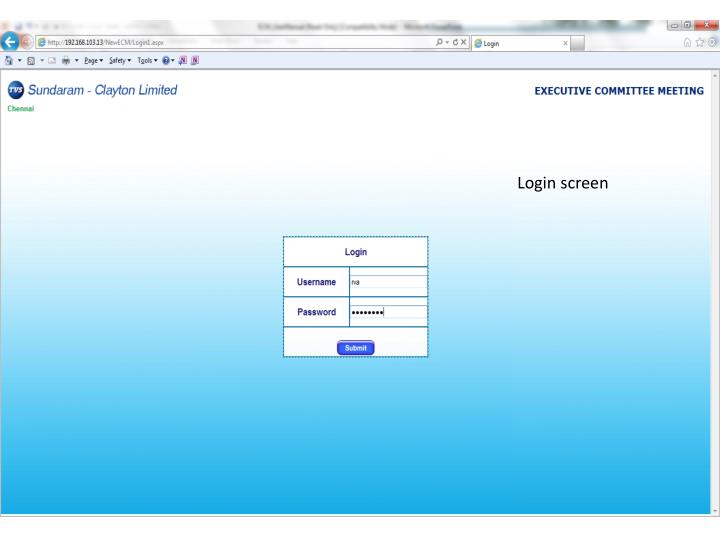
Login screen. Home screen. Steps to create a new Graph. Click on Graph Master from menu to create a new graph Once the Graph is created, click on Previous Year Actual menu Enter values for previous 3 years and click submit

E N D
Steps to create a new Graph • Click on Graph Master from menu to create a new graph • Once the Graph is created, click on Previous Year Actual menu • Enter values for previous 3 years and click submit • Click on Current Year Plan to enter current plan and last year actual • In case if the same graph is monitored last year also, Last year actual and previous 3 year actuals are automatically fetched. • Every month to enter actual values, we need to click on Current Year Actual from menu • In case if there is any variance we can use Variance option in menu • If we have to enter 3W1H, click on 3W1H option from menu • There may be some cases where we should have Gantt chart in place of regular chart. In such cases we have to use Gantt chart Plan to update plan values and Gantt Chart Actual to enter Actual data from menu
Select graph type Select department Select financial year Enter policy reference number Enter title of the graph Enter UOM of the title Enter responsible person Select if UP is better or DOWN is better Select order in which graph should be displayed Select graph model. Enter Revision No Choose whether Cumulative box should be displayed in Graph or not. Choose whether Cumulative box value should be done automatically or manually. Delete using Delete option if something is inserted by mistake. Use Edit option to modify the inserted data
Select department Select financial year Select type of graph Select graph title Enter previous 3 years value
Select department Select financial year Select type of graph Select graph title Enter Cumulative current year plan and cumulative last year actual for graphs which is set with cumulative box updation type as manual. Enter Current year plan and last year actual. Last year actual will be automatically fetched in case if it is mapped to last year graph.
Select department Enter actuals for all the graphs for a particular month and select save button. Select financial year Select month Select type of graph Select View link to view the graph. Enter cumulative Actual. This textbox will be enabled for graphs which is set with cumulative updation type as manual.
Select variance link a popup will open and enter variance values and click on submit button.
Select department Select Financial year Select Graph Type Select month Select graph title Enter top 3 parameters for variance in X and Y values To upload Files related to Variance Step 1: Select yes Step2: Select browse and upload Step3: Once file is uploaded it will be displayed in the grid.
Select department, Financial year, Type of graph , Month and Graph title from respective dropdowns. Based on graph title , existing meeting subject will be displayed . Enter new meeting subject Enter the name of members present for the meeting. Enter Review Date Enter Review Action Date Enter Venue Details Enter 3WIH data in respective textbox and Select Add New link
Select Department Select Financial Year Select Type of Graph Select Graph Title Enter Activity Enter Planned Start Data and End Date
Select Department Select Financial Year Select Type of Graph Select Graph Title Select Activity Planned Start date and End Date are fetched automatically based on the activity Enter Actual Start date and End date
Select Department Select Financial Year Select type of Graph Select current year graph title Select previous year graph title which is same as current year graph title Select Sum if the value for last three years to be cumulated. Select Average, if the value for last three years is average. Select Last 3 months average if value of last 3 months is average.
Select Month. Select Financial Year Select Type of Graph Select title for which the file should to be uploaded. Select browse button and choose a PDF file and select on submit . Uploaded file will be displayed as shown below . Select on delete link to delete the file. Select on file name to view the respective file.
ECM graph 3W1H link appears if 3W1H is entered for this graph Comments on graph can be entered here
DWM graph Variance Previous 3 years trend Current year Plan vs Actual
Upload Files Print Click on this link to view and take printout of uploaded pdf files.