Download
1 / 36
360 likes | 365 Vues
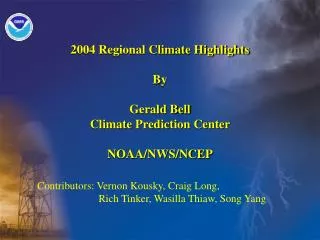
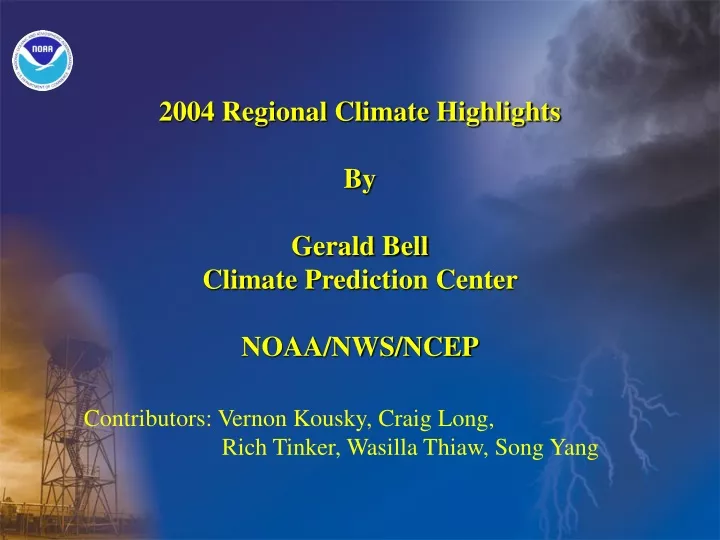
2004 Regional Climate Highlights By Gerald Bell Climate Prediction Center NOAA/NWS/NCEP. Contributors: Vernon Kousky, Craig Long, Rich Tinker, Wasilla Thiaw, Song Yang. Outline. Temperature and precipitation anomalies Indian and African monsoon seasons

E N D
2004 Regional Climate HighlightsByGerald BellClimate Prediction CenterNOAA/NWS/NCEP Contributors: Vernon Kousky, Craig Long, Rich Tinker, Wasilla Thiaw, Song Yang
Outline • Temperature and precipitation anomalies • Indian and African monsoon seasons • Active Atlantic, suppressed East Pacific hurricane seasons • Evolution to early stages of El Niño, MJO influence • Anomalous conditions over North America (Apr-Aug) • Stratosphere: Antarctic ozone • January stratospheric warming
Regional Temperature Anomalies during 2004 Hot and Dry, Wildfires Warm Warm Cool Summer El Niño Develops Warm
Jan.-Sep. 2004 Temperature Rankings 1 is the coldest since 1950 55 is warmest since 1950
Regional Anomalies during 2004 Hot and Dry, Wildfires Warm Drought Continues Warm Cool Summer Inactive East Pac. hurricanes Active Atlantic Hurricanes El Niño Develops Warm Suppressed rainfall 7 U.S. landfalling TC’s 5 landfalling TC’s (Jan-Mar)
Monsoon Rains • India • West Africa • Southern Africa
June-August India Monsoon Rainfall Total 2004 rainfall: 13% below average Above average Figure Courtesy: Song Yang See Yang and Yoo Poster 1.26 Below average
West Africa and Southern Africa Monsoon Rainfall Anomalies (mm) Posters: Thiaw and Mo, P. 1.2 Nicholson, P. 1.19 Thiaw, P. 1.28 Posters: Thiaw, P. 1.28
Anomalous 200-hPa VPOT andDivergent Wind Vectors Enhanced West African monsoon system and suppressed rainfall over Central America/ Amazon Basin predominant since 1995.
Anomalous 200-hPa STRM andRotational Wind Vectors Anticyclonic • Inter-hemispheric symmetry to anticyclonic streamfunction anomalies • Stronger subtropical ridges reflect enhanced West African monsoon system and suppressed Amazonian rainfall system (Chelliah and Bell 2004), • Classic for above-normal Atlantic hurricane seasons (Bell and Chelliah 2005)
Atlantic and East Pacific Hurricane Seasons See poster: Chelliah, Bell and Mo, P. 1.24
Very Active Atlantic hurricane Season 2004 Normals Tropical Storms 15 9-10 Hurricanes 8 5-6 Major Hurricanes 6 2 7 landfalling systems in 2004, 18 landfalls during 2002-2004. 14 of these systems made landfall along the Gulf Coast
Suppressed East Pacific hurricane Season 2004 Normals Tropical Storms 11 15 Hurricanes 6 9 Major Hurricanes 3 4.4 East Pacific hurricane seasons generally below normal since 1995
2004 Atlantic Tropical Cyclone Tracks MDR Above-normal seasons have large number of systems forming in Main Development Region (MDR). During 2004, 8 /14 TS, 7/8 H and 5/6 MH formed in MDR (9oN-21.5oN). Figure Courtesy Unisys Weather.com
Aug-Sep 2004: Total Precipitation (mm) during the periods in which the six landfalling tropical systems were producing precipitation in U.S., and % of 2-month total
Since 1995, 8 of 10 Atlantic hurricane seasons were above normal. On average 2-3 hurricanes hit the U.S. in above-normal seasons.
Amplified subtropical ridge (200-hPa) Stronger Tropical Easterly Jet Favorable AEJ Enhanced Cyclonic RELV Very low vertical wind shear (200 – 850 hPa) Weaker easterly trades 850-hPa westerlies Primary Conditions associated with Active 2004 Atlantic Hurricane Season Warmer SSTs These conditions have prevailed since 1995- 8 of 10 hurricane seasons have been above-normal. Also characterized the active decades of the 1950s-1960s
Standardized SST Departures in Main Development Region 1995 1970 Above normal 2004 Atlantic hurricane season associated with ongoing anomalous warmth across tropical Atlantic that began in 1995—reflects warm phase of Atlantic multi-decadal mode (Goldenberg et al. 2001)
Recent Decade of Favorable ConditionsAnomalies are relative to Inactive 1979-1994 Period Higher Shear Lower Shear Weaker easterlies Stronger Easterlies More cyclonic Less cyclonic Vertical Wind Shear: 200-850 hPa Bell et al., BAMS, May 2004 700-hPa Zonal Wind Averaging Regions 700-hPa Relative Vorticity
Evolution to Early Stages of El Niño See poster: Kousky, P. 1.15
Evolution of SST AnomaliesAveraged 5oN - 5oS • Largest positive SST anomalies were west of date line until July • Since July, anomalous warmth has persisted and expanded eastward. • Negative anomalies in eastern Pac. disappearing
Strong MJO during 2004200-hPa Velocity Potential Anomaliesaveraged 5N-5S Anomalous Convergence Anomalous Divergence MJO has produced significant variability in the atmosphere and in Pacific Ocean temperatures. No El Niño signature yet. See poster: Weickmann and Berry, P. 1.25
Area-Averaged SST Anomalies in Niño-4 and Niño 3 Regions Intraseasonal SST fluctuations are associated with oceanic Kelvin waves triggered by MJO In September, the anomalous warmth expanded eastward to cover Niño-3 region
Persistent April-July Circulation over North America • Hot and Dry Alaska • Cooler Canada, cooler summer in U.S. • Below-average Southwest U.S. monsoon
April-July 2004 300-hPa Heights and Temperatures Precipitation Percentiles
June-AugustMean Temperature Rankings 1 is the coldest since 1950 55 is warmest since 1950
Stratosphere • Antarctic Ozone hole • January N.H. Stratospheric Warming
Antarctic Ozone Hole (Concentrations <220 DU)NOAA SBUV/2 Satellite Estimate Figure Courtesy of Craig Long, poster P 1.23
January 2004 Stratospheric WarmingDaily Temperature Departures (C) Figure Courtesy of Craig Long, poster P 1.22
Height Anomalies (m) associated with 2004 Stratospheric Warming Stratospheric warming contributes to strong negative phase of the Arctic Oscillation
Summary • Many temperature and precipitation anomalies associated with • multi-decadal fluctuations: Chelliah and Bell 2004, Goldenberg et al. 2001) • Precipitation:Temperature • Enhanced West African monsoon Warm N. Atl • Drier Amazon Basin • Active Atl. hurricanes, • summertime eastern U.S. rainfall, • Evolution to early stages of El Niño • No single cause of N.A. circulation anoms. during Apr-Aug., hemispheric-scale pattern of anomalies, extended into middle strat. • January negative AO also linked to stratosphere—warming event • Antarctic ozone hole near 1994-2003 mean size