Download
1 / 1
10 likes | 247 Vues
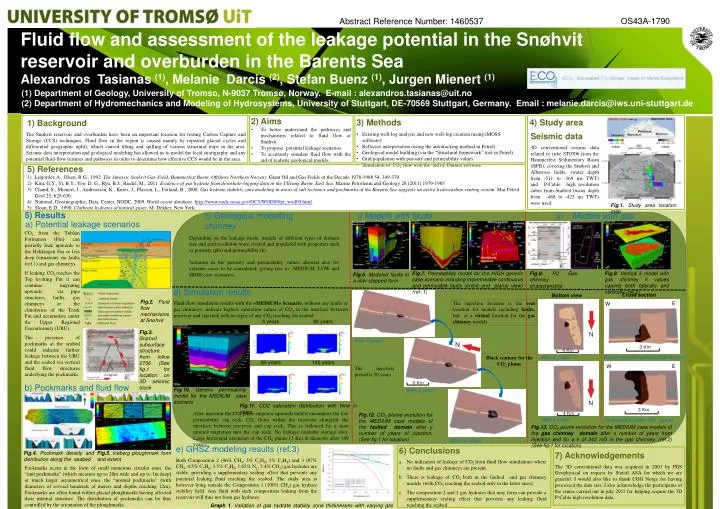
Abstract Reference Number : 1460537. OS43A-1790. Fluid flow and assessment of the leakage potential in the Snøhvit reservoir and overburden in the Barents Sea. Alexandros Tasianas (1) , Melanie Darcis (2) , Stefan Buenz (1) , Jurgen Mienert (1).

E N D
Abstract Reference Number: 1460537 OS43A-1790 Fluid flow and assessment of the leakage potential in the Snøhvit reservoir and overburden in the Barents Sea Alexandros Tasianas (1), Melanie Darcis (2), Stefan Buenz (1), Jurgen Mienert (1) (1) Department ofGeology, UniversityofTromso, N-9037 Tromsø, Norway. E-mail : alexandros.tasianas@uit.no (2)Department of Hydromechanics and Modeling of Hydrosystems, University of Stuttgart, DE-70569 Stuttgart, Germany. Email : melanie.darcis@iws.uni-stuttgart.de • 2) Aims • To better understand the pathways and mechanisms related to fluid flow at Snøhvit. • To propose potential leakage scenarios. • To accurately simulate fluid flow with the aid of realistic geological models. • 3) Methods • Existing well-log analysis and new well-log creation (using iMOSS software) • Reflector interpretation (using the autotracking method in Petrel) • Geological model building (via the “Structural framework” tool in Petrel) • Grid population with porosity and permeability values • Simulation of CO2 flow with the aid of Dumux software 4) Study area 1) Background Seismic data 3D conventional seismic data related to cube ST0306 from the Hammerfest Sedimentary Basin (HFB), covering the Snøhvitand Albatross fields, (water depth from -511 to -369 ms TWT) and P-Cable high resolution cubes from Snøhvit(water depth from -468 to -425 ms TWT) were used. The Snøhvit reservoir and overburden have been an important location for testing Carbon Capture and Storage (CCS) techniques. Fluid flow in the region is caused mainly by repeated glacial cycles and differential geographic uplift, which caused tilting and spilling of various structural traps in the area. Seismic data interpretation and geological modeling has allowed us to model the local stratigraphy and any potential fluid-flow features and pathways in order to determine how effective CCS would be in the area. • 5) References • Linjordet, A., Olsen, R.G., 1992. The Jurassic Snohvit Gas-Field, Hammerfest Basin, Offshore Northern Norway. Giant Oil and Gas Fields oftheDecade 1978-1988 54, 349-370 • Kim, G.Y., Yi, B.Y., Yoo, D. G., Ryu, B.J., Riedel, M., 2011. Evidenceof gas hydrate from downhole-logging data in theUlleungBasin, East Sea. Marine Petroleum and Geology 28 (2011) 1979-1985 • Chand, S., Mienert, J., Andreassen, K., Knies, J., Plassen, L., Fotland, B., 2008. Gas hydrate stability zone modeling in areas of salt tectonics and pockmarks of the Barents Sea suggests an active hydrocarbon venting system. Mar Petrol Geol 25, 625-636. • National, Oceanographic, Data, Center, NODC, 2009. World ocean database. http://www.nodc.noaa.gov/OC5/WOD09/pr_wod09.html. • Sloan, E.D., 1990. Clathrate hydrates of natural gases. M. Dekker, New York. Fig.1. Study area location map 5) Results c) Geologicalmodellingi) Models withfaultsii) Models with gas chimney 1 a) Potentialleakage scenarios CO2from the TubåenFormation (Fm) can partially leak upwards to the HekkingenFm or less deep formations via faults (ref.1) and gas chimneys. If leaking CO2 reaches the Top kvittingFmit can continue migrating upwards via pipe structures, faults, gas chimneys or the clinoforms of the TorskFm and accumulate under the Upper Regional Unconformity (URU). The presence of pockmarks at the seabed could indicate further leakage between the URU and the seabed via vertical fluid flow structures underlying the pockmarks. Depending on theleakagemode, modelsof different typesofdomainsizeandgridresolutionwerecreatedandpopulatedwithpropertiessuch asporosity (phi) andpermeability (k). Variation in theporosityandpermeabilityvaluesallowedalso for extreme cases to beconsidered; givingrise to MEDIUM, LOW and HIGH casescenarios. Fig.7. Permeability model for the HIGH generic case scenario including impermeable continuous and permeable faults (entire and planar view) (ref .1) Fig.9. Vertical k model with gas chimney kvalues varying both laterally and vertically (ref.2) Fig.8.P2 Gas chimney characteristics Fig.6.Modeled faults in a stair stepped form • d) Simulationresults • Fluid-flowsimulationresultswiththe«MEDIUM» Scenario, withoutanyfaults or gas chimneys, indicate highest saturation values of CO2in the interface between reservoir and cap rock with no signs of any CO2 reaching the seabed. Cross section Bottom view Fig.2. Fluid flow mechanisms at Snøhvit The injectionlocation is thereallocation for modelsincludingfaults,butat a virtual location for thegas chimneymodels E W 4 years 40 years Fig.3. Snøhvit subsurface structure from inline 2706 (See fig.1 for location on 3D seismic block ST0306) After 2 years End ofinjectionperiod (after 40 yrs) After 2 years Black contour for the CO2plume 80 years 140 years E W The injectionperiod is 30 years b) Pockmarks and fluid flow Fig.10. Generic permeability model for the MEDIUM case scenario After 5 years Fig.11. CO2 saturationdistributionwith time in years Afterinjection the CO2phase migrates upwards until it encounters the low permeability cap rock. CO2flows within the reservoir alongside the interface between reservoir and cap rock. This is followed by a slow upward migration into the cap rock. No leakage (suitable storage site). Large horizontal extension of the CO2 plume (3 Km in diameter after 140 years). Fig.12. CO2 plume evolution for the MEDIUM case modelsofthefaulteddomainafter y numberofyearsofinjection. (See fig.1 for location) After 5 years Postinjection (after300 years) Fig.13.CO2 plume evolution for the MEDIUM case modelsofthegas chimneydomainafterx numberofyears from injection and for a k of 342 mD in the gas chimney. (ref.2) (See fig.1 for location) After 30 years e) GHSZ modelingresults (ref.3) Both Composition 2 (96% CH4, 3% C2H6, 1% C3H8) and 3 (87% CH4, 4.5% C2H6, 3.5% C3H8, 1.65% N2, 3.4% CO2) gas hydrates are stable, providing a supplementary sealing effect that prevents any potential leaking fluid reaching the seabed. The study area is however lying outside the Composition 1 (100% CH4) gas hydrate stability field. Any fluid with such composition leaking from the reservoir will thus not form gas hydrates. 6) Conclusions No indication of leakage of CO2 from fluid flow simulations where no faults and gas chimneys are present. There is leakage of CO2 both in the faulted and gas chimney models (with CO2 reaching the seabed only in the latter ones). The composition 2 and 3 gas hydrates that may form can provide a supplementary sealing effect that prevents any leaking fluid reaching the seabed. Fig.4. Pockmark density and distribution along the seabed Fig.5. Iceberg ploughmark form and extent 7) Acknowledgements The 3D conventional data was acquired in 2003 by PGS Geophysical on request by Statoil ASA for which we are grateful. I would also like to thank CGG Norge for having processed the data sets. I also acknowledge the participants of the cruise carried out in july 2011 for helping acquire the 3D P-Cable high resolution data. Pockmarks occur in the form of small numerous circular ones, the “unit pockmarks” (which measure up to 20m wide and up to 1m deep) or much larger asymmetrical ones, the “normal pockmarks” (with diameters of several hundreds of meters and depths reaching 12m). Pockmarks are often found within glacial ploughmarks having affected their internal structure. The distribution of pockmarks can bethus controlled by the orientation of the ploughmarks. Graph 1. Variation of gas hydrate stability zone thicknesses with varying gas composition