Download
1 / 29
290 likes | 374 Vues
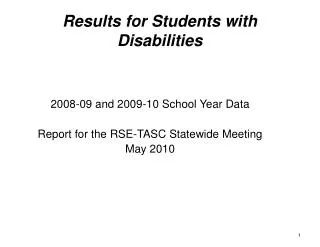
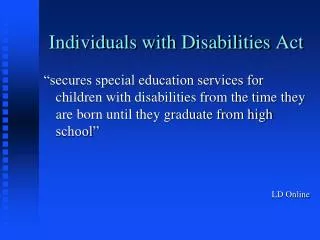
Results for Students and Individuals with Disabilities September 2008. 2006 - 2008 English Language Arts (ELA) Students with Disabilities.

E N D
Results for Students and Individuals with Disabilities September 2008
2006 - 2008 English Language Arts (ELA) Students with Disabilities The percentage of students with disabilities meeting the ELA Learning Standards increased at every grade level except Grade 8 even with the increase in ELL students with disabilities tested. Number Tested - 2006 2007 2008 Grade 3 = 23,811 26,692 27,285 Grade 4 = 26,474 28,281 29,983 Grade 5 = 28,987 29,985 30,661 Grade 6 = 28,883 29,055 31,195 Grade 7 = 29,237 29,842 31,180 Grade 8 = 29,119 29,514 31,077 Grades 3-8= 166,511 173,369 181,381 Percentage of Students Scoring at Levels 3 and 4
2006 - 2008 English Language Arts (ELA)Students with Disabilities There is a decease in the percentage of students with disabilities scoring at Level 1 in all grades for the past two years. The decreases in Grades 5, 6 and 7 are substantial and improvement has been sustained from one grade to the next. Percentage of Students Scoring at Level 1
2006 - 2008 English Language Arts (ELA) Students with Disabilities Performance in Grades 3 - 8 by Need/Resource Capacity Category In every category, there was anincrease in the percentage of students with disabilities who scored at proficient levels in ELA in 2008 compared to 2007 or 2006. Percentage of Students Scoring at Levels 3 and 4
2006 - 2008 English Language Arts (ELA) Students with Disabilities Performance in Grades 3 - 8 by Need/Resource Capacity Category The percentage of students with disabilities scoring at Level 1 has been cut in half in most Need/Resource Capacity categories over two years of testing. Percentage of Students Scoring at Level 1
2006 - 2008 English Language Arts (ELA)Students with Disabilities English Language Learners Performance remains extremely low for ELL students with disabilities, especially for the declining number who remain designated as ELL in grades 6, 7, and 8. Number Tested 2005-06 Grade 3: 1,512 Grade 4: 1,858 Grade 5: 2,477 Grade 6: 2,246 Grade 7: 2,195 Grade 8: 2,194 Grades 3-8 Combined: 12,482 Number Tested 2006-07 Grade 3: 3,816 Grade 4: 3,783 Grade 5: 3,451 Grade 6: 2,935 Grade 7: 2,534 Grade 8: 2,433 Grades 3-8 Combined: 18,952 Number Tested 2007-08 Grade 3: 3,474 Grade 4: 3,606 Grade 5: 3,295 Grade 6: 2,841 Grade 7: 2,351 Grade 8: 1,933 Grades 3-8 Combined: 17,500 Percentage of Students Scoring at Levels 3 and 4
2006-07 and 2007-08 Students with Disabilities Grades 3-8 ELA – Statewide by Race/Ethnicity Level 3 or 4 There is an increase in the statewide percentages of students with disabilities scoring at Levels 3 or 4 in all the race/ethnicity categories. Whites (35.3%) and Asian/Pacific Islander (35.2%) had the highest percentage of students with disabilities score on Grade 3-8 ELA at Level 3 or 4. The largest percentage increases of scoring in Levels 3 or 4 in 2008 was Blacks (+46%) and Hispanics (+36%) and American Indian/Alaskan Natives (28%). Percentage of Students Scoring at Level 3 or 4 2007 2008 2007 2008 2007 2008 2007 2008 2007 2008
2007-08 Students with Disabilities ELA Grades 3-8 by Gender Levels 3 - 4 Statewide Performance is similar for male and female students with disabilities with males out-numbering females by approximately 2 to 1 across all grade levels. • Number of Students With Disabilities Tested • Grade Female Male • 3 8,474 18,811 • 4 10,013 19,970 • 5 10,665 19,996 • 6 10,876 20,319 • 7 10,751 20,429 • 8 10,668 20,409 Percentage of Students Scoring at Levels 3 or 4 Female Male Female Male Female Male Female Male Female Male Female Male
2006-07 and 2007-08 Students with Disabilities Statewide Grades 3-8 ELA by Race/Ethnicity and Gender Level 3 or 4 There is an increase in the statewide percentages of students with disabilities Grade 3 to 8 ELA scoring at Levels 3 or 4 for each genderin all the race/ethnicity categories. The largest percentage of students with disabilities to score on Grade 3 – 8 ELA Level 3 or 4 was Asian/Pacific Islander Females (36.9%); White Males (35.4%); White Females (35%) and Asian /Pacific Islander Males (34.4%). The greatest percentage increase for scoring ELA Level 3 or 4 was Black Females (+50%); Black Males (43%); Hispanic Females (+42%) and Hispanic Males (+34%). Percentage of Students Scoring at Level 3 or 4 Female Male Female Male Female Male Female Male Female Male
2006 - 2008 Mathematics - Students with Disabilities The percentage of students with disabilities meeting the mathematics learning standards increased substantially in 2008 in every grade. Number Tested 2006 2007 2008 Grade 3 = 27,045 26,780 27,325 Grade 4 = 29,043 28,327 30,072 Grade 5 = 30,290 29,960 31,662 Grade 6 = 30,077 29,040 31,119 Grade 7 = 29,791 29,659 31,037 Grade 8 = 29,539 29,305 30,899 Grades 3-8= 175,785 173,071 181,114 Percentage of Students Scoring at Levels 3 and 4
2006 - 2008 Mathematics - Students with Disabilities There is a substantial decease in the percentage of students with disabilities scoring in math at Level 1 in all grades in each of the past two years. Percentage of Students Scoring at Level 1
2006 - 2008 Mathematics Levels 3 or 4 in Grades 3 - 8 Students with Disabilities by Need/Resource Capacity Students with disabilities have improved their math scoring performance in allthe Need / Resource Capacity categories in each of the past two consecutive years. The greatest percentage increases at Level 3 or 4 scoring was in Large Cities (+57.5%); Urban-Suburban High Need districts (+38.7%) and New York City districts (+32.3%). Percentage of Students Scoring at Levels 3 and 4
2006 - 2008 Mathematics Performance in Grades 3 - 8 Students with Disabilities by Need/Resource Capacity Students with disabilities in Large City Districts were about 4 times as likely as those in Low Need Districts to score at Level 1. The percentage of students with disabilities scoring at Level 1decreased in every Need / Resource Capacity category for two consecutive years. . The largest percentage decrease in Level 1 scoring was in New York City (-31.9%); Low Need Districts (-28.7%) and the Large City Districts (-28.0%) Percentage of Students Scoring at Level 1
2006-07 and 2007-08 Students with Disabilities Grades 3-8 Math - Levels 3 or 4 Statewide by Race/Ethnicity There is an increase in the statewide percentages of students with disabilities scoring in grade 3-8 math at Levels 3 or 4 in all the race/ethnicity categories. Asian/Pacific Islander students with disabilities significantly outperform all other groups. Percentage of Students Scoring at Level 3 or 4 2007 2008 2007 2008 2007 2008 2007 2008 2007 2008
2007-08 Students with Disabilities Math Grades 3-8 by Gender Levels 3 - 4 Statewide Number of Students With Disabilities Tested Grade Female Male 3 8,478 18,847 4 10,038 20,034 5 10,667 19,995 6 10,843 20,276 7 10,699 20,338 8 10,605 20,294 In math, males outperform female students with disabilities across all grade levels. Percentage of Students Scoring at Levels 3 or 4 Female Male Female Male Female Male Female Male Female Male Female Male
Regents English Examination Students with Disabilities Since 1997, there has been more than 514% increase in the number of students with disabilities tested. Of the students tested in 2007, 63% achieved a score between 55-100. Public Schools-Including Charter Schools
Regents Competency TestsExaminations Students with Disabilities Large numbers of students with disabilities were tested on most RCT examinations. From 2002 to 2007 Regents Competency Testing for Reading increased by 77%; Writing by 85%; and Mathematics by 22%. Public Schools, Including Charter Schools
Percent of Students with Disabilities Passing each Regents Competency Tests The Regents Competency Tests remain significant towards students with disabilities meeting graduation requirements. There has been a notable increase in the number of students with disabilities who have passed the RCT in Reading (59%) and Writing (94%) from 2002 to 2007 6,146 7,212 3,723 6,137 6,404 4,737 11,159 5,861 4,950 10,030 3,968 5,839 6,308 6,309 7,187 8,163 8,083 7,519 Public Schools, Including Charter Schools
High School Outcomes for 2002 and 2003 Total Cohort There is a significant increase in students with disabilities graduation rate after 5 years
2003 Total Cohort after Four Years as of June Graduation, IEP Diploma and Dropout Rates The Average and Low Need Districts have higher graduation rates, lower IEP diploma rates and lower dropout rates compared to the High Need Districts. The five cities had the lowest graduation rates and the highest drop out rates. The rate of use of the IEP diploma varies widely across Need Resource Capacity categories. 2003 Total Cohort 8,407 1,536 2,778 2,223 9,563 3,873
2002 Students with Disabilities Total Cohort after Four and Five Years Graduation and Dropout Rates Greater percentages of students with disabilities graduated after five years of school compared to four years in every Need Resource Capacity category of school districts. 5 Years 4 Years 5 Years 5 Years 4 Years 4 Years 5 Years 5 Years 4 Years 4 Years 4 Years 5 Years 5 Years 4 Yrs 4 Years 5 Years 5 Years 4 Years 4 Years 5 Yrs 4 Yrs 4 Years 5 Years 5 Yrs Number In Cohort: 6,813 1,735 2,485 2,316 9,683 3,925
2003Total Cohort Graduation Rate General Education Students and Students with Disabilities Percentage of Students Graduating with Regents or Local Diploma After 4 Years By Need/Resource Capacity Category There are similarities in the slope of the graduation rates of general education and students with disabilities, with students with disabilities in Low Need districts graduating at a higher rate than general education students in NYC, the Big4, and Urban-Suburban districts. Results Through June 2007
Number of Individuals with Disabilities and Percent they are of Total Enrollment in NYS Institutions of Higher Education* The number of self-identified individuals with disabilities in New York State higher education programs is increasing. 3.6% 3.6% 3.5% 3.4% 3.4% 3.4% 3.3% 3.0% 2.8% Source: OHE *Data for 1998 are not available
Improving Graduation and Drop-Out Rates for Students with Disabilities Requires…
Coming to High School Prepared P-16 Actions: • Providing professional development and support to schools to use “Quality Indicator Review and Resource Guides” for • Adolescent literacy instruction • Positive behavioral supports, particularly small group and individualized interventions • Monitoring every school district’s policies and procedures when the data shows they have a disproportionate rate of long-term suspensions of students with disabilities.
Access to Content Area Instruction and Credit Bearing Courses P-16 Actions • We have set policy to promote integrated co-teaching (special education and general education co-teaching) • We are providing professional development and support to schools to provide research-based strategy and direct instruction to students with disabilities, particularly in adolescent literacy
Transition Planning P-16 actions: • Monitoring every school district to ensure the IEPs of students with disabilities, ages 15 and older, include good transition planning (goals and services to help the student reach his/her post school goals) • Directing Transition Coordination Sites to provide technical assistance to schools with low graduation and/or high drop out rates for students with disabilities • Funding 60 model transition school-based programs to support school-to-work and school-to-higher education transition services in collaboration with VR and adult providers
Additional Strategies • Explore the development of career and technical education program options with engaging curriculum and content instruction • Recognize schools with higher 5 year graduation rates • Address IEP diploma policy to limit its use to students with the most severe disabilities
Expanding State’s Technical Assistance Resources • Parent Centers – statewide (11 new) – 2 continuing • Mediation • State RTI Technical Assistance Center • PBIS Statewide Technical Assistance Center • Schools with Effective Instructional Practices for Students with Disabilities