Download
1 / 14
140 likes | 233 Vues
Presentation Structure. Thematic and objective Database building Data collection Data framework Data formatting African Dataset coherence PCA analysis Linear regression analysis Extension of the dataset. South Africa EuropeAid, F.Lefèbvre. Thematic and questions.

E N D
Presentation Structure Thematic and objective Database building Data collection Data framework Data formatting African Dataset coherence PCA analysis Linear regression analysis Extension of the dataset South Africa EuropeAid, F.Lefèbvre
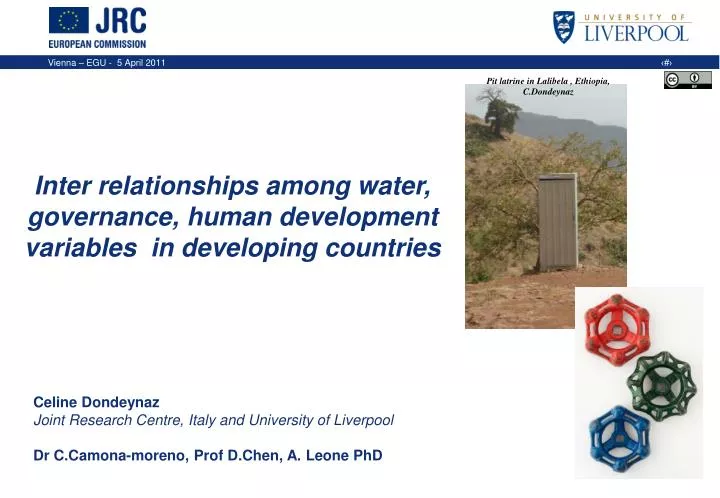
Thematic and questions • The efficiency of the WSS management in a specific developing country = a combination of a wide range of variables¹= > a complex and a cross cutting issue • OBJECTIVE :Better understand the keys elements involved in an improved WSS management. • Main QUESTIONS • 1. Are the different variables and data coherent enough to establish spatial-temporal behaviors? • 2. Can be established measurable protocols/models and can patterns be extrapolated in time? ¹ Integrated water resources management Principles laid down at the International Conference on Water and the Environment held in Dublin in January 1992
Data collection • Data collection • International data providers : UNEP – FAO – JRC – WB … • Scale : National country level over the world • Time series : consistency issue requires a strict examination of data coherence and methodologies. 2004 year of reference • Variables selection criteria • Relevance : potential role regarding water supply and sanitation • Data availability : enough observations • Reliability : produced by trustfully providers and with described methods 132 indicators analysed shortlist of53indicators
Data framework • Environmental Cluster • Water resources availability • (Water poverty index, Water stress, water bodies ...) • Land cover indicators (dryland coverage, biodiversity index..) • Human pressure Cluster • Activities pressure ( water demand, irrigation level, industrial pollution, production indexes...) • Demographic pressure ( growth, repartition Urban-rural • Accessibility to WSS Cluster • Population access to Sanitation • Population access to Water Supply Governance cluster Stability and level of violence, government effectiveness, rule of law, regulatory quality , control of corruption • Country Well being Cluster • Health indicators (water-born disease, mortality, life expectancy..) • Poverty indicators ( HDI, National poverty index, education level...) • Education indicators Official Development aid flow : global and WSS ODA
Data formatting • Process • Normalization • Missing data treatment: Imputation • Step 1 Variables Normalization • Standard normalization (SQRT- LOG - OLS) not possible on the worldwide dataset because of strong heterogeneous behaviour among countries • as preliminary phase => Restriction to Africa = 52 countries • Test of what? • Missing data methods • Methods used for data coherency • Foreseen modelling methods • Normalization Issue • Processing the extremities distribution
Data formatting • Step 2 Missing Data treatment • Objective : Qualitative approach • => find order of magnitude rather than exact value • Method • Expectation – Maximization algorithm combined with bootstraps (EMB)1 • Assumptions: • - the complete data (that is, both observed and unobserved) are multivariate normal. • - the data are missing at random (MAR). • STEP by STEP imputation process starting from the ones with less missing data to the more incomplete ones. ¹Amelia II software is provided by Honaker James, King Gary, Blackwell Matthew, http://gking.harvard.edu/amelia/
Dataset coherency verification • 1. Checking Variable Relationships Coherence Principal component Analysis (PCA) Adjusted R² = 50.386 (3 components) On F1 axis group 1-2 representing the society development – poverty On F2 group 3-4 represents the balance between water demand and resources Coherency of the dataset on Africa Group 4 Group 1 Group 2 Group 3 figure: the first two PCA factors of variables, (accumulated variability equal to 43,02%)
Dataset coherency verification • 2. Linear regression • Objectives: • Look for incoherent behaviours • Test if linear models could be used in a later stage • Water supply coverage and sanitation coverage are analysed separately • The coherency of the final model relies on: • the significance of the variables • the confidence intervals
Preliminary phase on Africa • Anova with stepwise method • Dependent variable: Water supply access level (AIWS) • Adjusted R² = 0.629 • Standards parameters of the final model a Dependent Variable: TOT.AIS.2004
Preliminary phase on Africa • Anova with stepwise method • Dependent variable: Sanitation access level (AIS) • Adjusted R² = 0.555 • Standards parameters of the final model a Dependent Variable: TOT.AIS.2004
Conclusions of the preliminary phase • On AFRICA • Good points: • The dataset is coherent – IF data considered qualitative/estimates • Linear models explain most of the variability • Limits • Too few observations (52 countries) versus variables number (45 variables) • Variability (38%) in both cases remains not completely explained => Complex relationships between variables
Extension of the dataset • SOLVING POINT 1: too few observations • Available Options : • Increasing the number of observations • Grouping variables • We start with option 1 : • -> clustering worldwide countries list • -> using different Agglomerative Hierarchical Clustering (AHC) methods with several distances • -> looking at the stability of results • Increasing the dataset by adding countries with similar behaviours to African’s
Thanks you for your attention • Questions?