Download
1 / 2
20 likes | 112 Vues
Peach. Apricot. J×F6 BC 2 6. ‘Perfection’. +. -. +. -. QTLs for flowering date. QTLs for chilling requirement and beadbreak.

E N D
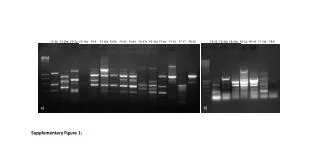
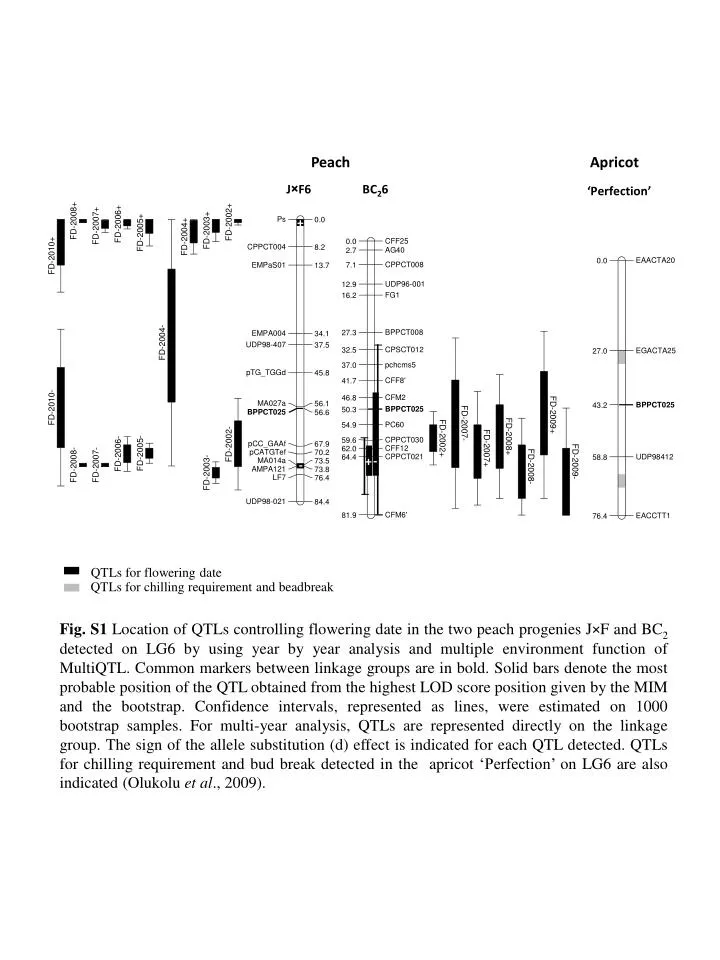
Peach Apricot J×F6 BC26 ‘Perfection’ + - + - QTLs for flowering date QTLs for chilling requirement and beadbreak Fig. S1 Location of QTLs controlling flowering date in the two peach progenies J×F and BC2 detected on LG6 by using year by year analysis and multiple environment function of MultiQTL. Common markers between linkage groups are in bold. Solid bars denote the most probable position of the QTL obtained from the highest LOD score position given by the MIM and the bootstrap. Confidence intervals, represented as lines, were estimated on 1000 bootstrap samples. For multi-year analysis, QTLs are represented directly on the linkage group. The sign of the allele substitution (d) effect is indicated for each QTL detected. QTLs for chilling requirement and bud break detected in the apricot ‘Perfection’ on LG6 are also indicated (Olukolu et al., 2009).
Apricot Sweet cherry Almond R4 G4 RxD4 Lb - - + QTL for flowering date Major gene Lb Fig. S2 Location of QTLs controlling flowering date detected on LG4 for the apricot ‘Goldrich’ and the sweet cherry ‘Regina’ detected by using year by year analysis and the multiple environment function of MultiQTL. Common markers between linkage groups are in bold. Solid bars denote the most probable position of the QTL obtained from the highest LOD score position given by the MIM and the bootstrap. Confidence intervals, represented as lines, were estimated on 1000 bootstrap samples. The sign of the allele substitution (d) effect is indicated for each QTL detected. Comparison with the location of the major gene Lb in almond (Sánchez Pérez et al., 2007).