Download
1 / 29
320 likes | 464 Vues
Years of Potential Life Lost: Valuable Information, oR Just More Numbers?. Kirk Bol, MSPH, Vital Statistics Unit, Health Statistics & Evaluation Branch Colorado Department of Public Health and Environment. June 8, 2014 NAPHSIS Annual Meeting. Measuring mortality in Colorado.

E N D
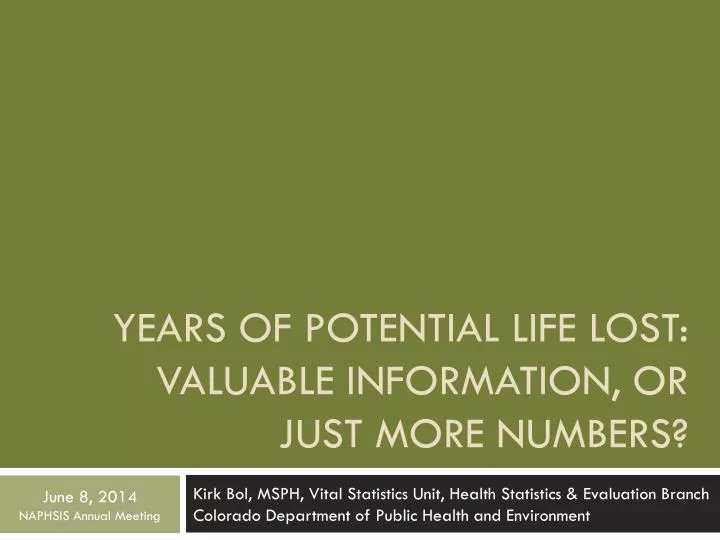
Years of Potential Life Lost: Valuable Information, oR Just More Numbers? Kirk Bol, MSPH, Vital Statistics Unit, Health Statistics & Evaluation Branch Colorado Department of Public Health and Environment June 8, 2014 NAPHSIS Annual Meeting
Measuring mortality in Colorado • Available methods… • Leading causes of death (based on counts) • Age-adjusted and age-specific mortality rates • Life and healthy life expectancy • Years of potential life lost (YPLL)
Gaps Population Mortality Mortality Counts and Rates Life Expectancy
Years of potential life lost • Defined as the years of potential life lost due to premature death.
Years of potential life lost • 63.8% of YPLL-65 during 2010-2012 attributed to 5 leading causes • Between 60%-69% across all race/ethnicities (2010-2012) • Between 57%-67% across all area-based poverty levels (2007-2011) • Between 58%-82% across Colorado’s Health Statistics Regions (2010-2012)
Filling the gaps… Population Mortality Mortality Counts and Rates Life Expectancy Years of Potential Life Lost
For inquiries or more information, please contact the Vital Statistics Unit, Health Statistics & Evaluation Branch,Colorado Department of Public Health and Environment4300 Cherry Creek Drive SouthDenver, Colorado 80246-1530P: (303) 692-2160 | (800) 886-7689 | F: (303) 691-7821cdphe.healthstatistics@state.co.us | www.chd.dphe.state.co.us Kirk Bol, MSPH, Vital Statistics Unit, Health Statistics & Evaluation Branch Colorado Department of Public Health and Environment June 8, 2014 NAPHSIS Annual Meeting