Download
1 / 15
150 likes | 244 Vues
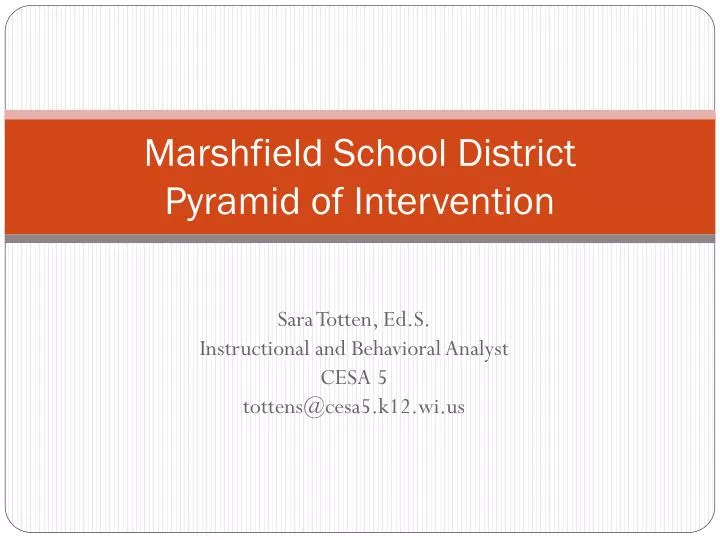
Marshfield School District Pyramid of Intervention. Sara Totten , Ed.S . Instructional and Behavioral Analyst CESA 5 tottens@cesa5.k12.wi.us. Overview. Types of Assessment Grouping/Interventions Progress monitoring and Data interpretation. The Three Tiers: Academic. Tier 1: Universal

E N D
Marshfield School DistrictPyramid of Intervention Sara Totten, Ed.S. Instructional and Behavioral Analyst CESA 5 tottens@cesa5.k12.wi.us
Overview • Types of Assessment • Grouping/Interventions • Progress monitoring and Data interpretation
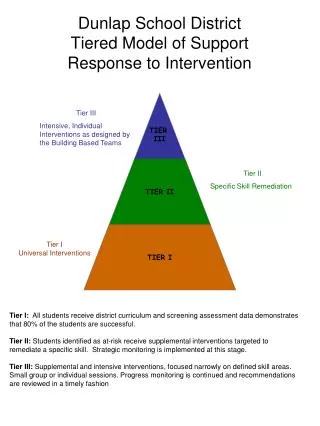
The Three Tiers: Academic • Tier 1: Universal • Includes differentiated instruction, evidence-based curriculum, and interventions within the regular education classroom setting. • Tier 2: Selected • Includes small groups of students receiving evidence-based interventions for a targeted skill area(s) in addition to the regular education class. • Tier 3: Individualized • Includes student specific evidence-based intervention provided in addition to tiers 1 and 2.
Universal Screening • Used to identify students at-risk • Nationally normed, standardized, generalizable • www.rti4success.org • DIBELS • Aimsweb • www.easycbm.com • The ABCs of CBM by Michelle K. Hosp, John L. Hosp, and Kenneth W. Howell
Formative Assessments • Used to support or negate need for assessment • Examples: district developed assessments, teacher observation, running records, class work, etc.
Grouping • According to intervention needs • Ex: 5 students performed in the at-risk range on letter identification • According to instructional needs • General ed teacher • Specialist teacher • Interventionist
What are evidence-based interventions? • Interventions with research supporting their efficacy • www.interventioncentral.org • http://ies.ed.gov/ncee/wwc/ • http://core.ecu.edu/psyc/rileytillmant/ECU-EBIProject/ECU-EBIProject.htm • http://www.apa.org/pi/cyf/evidence.html • School-Wide Prevention Models: Lessons Learned in Elementary Schools by Charles R. Greenwood, Ph.D.; Thomas Kratochwill, Ph.D.; Melissa Clements, Ph.D. • Effective Instructional Strategies: From Theory to Practice by Kenneth D. Moore • Effective School Interventions, Second Edition: Evidence-based strategies for improving student outcomes by Natalie Rathvon
Progress monitoring • Measure short-term gains • Administer every 1 to 2 weeks • CBM, DIBELS, Aimsweb, etc. • Data interpretation
Graphing • Baseline • Median score of first three probe scores • Aimline • Goal • Trendline • Step 1: Divide the data points into three equal sections by drawing two vertical lines. (If the points divide unevenly, group them approximately). • Step 2: In the first and third sections, find the median data-point and median instructional week. Locate the place on the graph where the two values intersect and mark with an “X”. • Step 3: Draw a line through the two “X’s”, extending to the margins of the graph. This represents the trend-line or line of improvement.
Alexis’s trend-line X X X Alexis’s goal-line
Decision Rules: Tiers 2 and 3 • Trendline analysis: after 9-12 data points are collected, the slope of the trendline is compared to the slope* of the aimline • 3-day rule: decision is made after 3 to 5 median scores fall above or below the aimline • Moving median: decision is made when 3 data points representing median scores fall above or below the aimline
*Determining Slope • M=rise/run=change in y/change in x • (y2-y1)/(x2-x1)=slope • In the example (trendline): (8-7)/(7-2)=.2
Decision Rules • Dual Discrepancy (Matt Burns, Univ. of MN) • Low academic performance: CBM scores demonstrate the student is performing approximately 2 grade levels below their peers (level) • Poor Response to appropriate instruction: the student continues to perform at a significantly lower rate even after appropriate intervention (growth)
Additional considerations • Fidelity of intervention • Qualitative vs. quantitative • Convergence of data • Need for alternative or more intense intervention • Feasibility of providing intervention in the general education setting