Download
1 / 1
10 likes | 156 Vues
Figure 5: Survival curves for patients with HIPP=1 and HIPP>1. Figure 3: Autosegmented MTV. Figure 4: ROC Curve for median Survival time (246d). Multiparametric and Multimodality Quantitative Imaging for Evaluation of Response to Cancer Therapy.

E N D
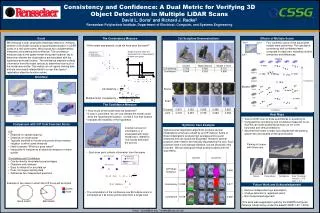
Figure 5: Survival curves for patients with HIPP=1 and HIPP>1. Figure 3: Autosegmented MTV. Figure 4: ROC Curve for median Survival time (246d). Multiparametric and Multimodality Quantitative Imaging for Evaluation of Response to Cancer Therapy We are studying the factors affecting reproducibility of SPECT images using phantom, simulation, and patient studies. Absolute quantification in SPECT requires a calibration factor (CF) to convert voxel values to activity. We systematically investigated the best methods to obtain accurate, precise, and repeatable CFs. We performed a retrospective analysis of the variability of the CF using data from 46 Bexxar therapies performed over a 4 year period. Part of the therapy included measuring the CF at 3 time points using a vial containing I-131 with activity measured using a dose-calibrator before each acquisition. The coefficient of variation (COV) was 2.4% over all 138 measurements, and decreased to 1.4% if the activity from the dose calibrator measurements for the same source were averaged.We used a statistical mixed-effects model and found that the largest source of variation was the filling and measurement of syringe activity and the second was variation in the background count rate. The data indicated that the CF was very stable over time, indicating that frequent recalibration is not essential. Based on the data above, it is desirable to use a sealed calibration source where preparation and measurement are not needed. In addition, background effects can be reduced by defining a ROI around the source rather than using the counts in the entire FOV. To verify this we performed a series of measurements using sealed Ba-133 sources. We studied variation of the calibration factor over time, and as a function of source size, position in front of the camera, and source-to-camera distance. To reduce the effects of background radiation, we used a reproducible method of defining an ROI in the projections based on the source size and collimator parameters. Using this method essentially eliminated variability in the CF due to background effects. The data demonstrated that the source should be large compared to the system resolution and collimator hole size. For such a source the position in the front of the camera did not affect the CF. Further, the distance from the face of the camera to the source should be accurate to within 5 mm. Under these conditions, the variability in the CF was less than 1% and dominated by Poisson noise and could be further reduced by longer counting times. Biological variability is an important issue in quantitative imaging. We first studied uptake variability of In-111 Octreoscan, used to image neuroendocrine tumors, in the liver and kidneys. We retrospectively analyzed scans from 7 patients imaged two or more times and computed maximum, peak, and mean SPECT-UV values. The COVs in the kidneys and liver were, respectively, 28 and 72% over all scans and 17 and 38% between scans for the same patient averaged over all patients. The intraclass correlation coefficients, indicating the fraction of variation due to patient differences, were 0.32 and 0.73 for the liver and kidneys. The intra-patient variability in kidney SPECT-UV was similar to that previously reported for the liver SUV for FDG-PET. Inter-patient organ SPECT-UV variability was greater than intra-patient variability, suggesting that patient-specific criteria are needed. The reliability of SPECT-UV in normal organs indicates it may find an important role in standardizing the assessment of treatment response in tumors imaged with SPECT radiopharmaceuticals. We acknowledge the following collaborators for their contributions to the results above. MRI and Oncology: R.H. EI-Khouli, MD, PhD., V. Stearns, MD., K. Macura, MD, Ph.D., I. Kamel. MD, PhD., D. A. Bluemke, MD, PhD, A. Wolff, MD., M. Carducci, MD SPECT/CT: N. Anizan PET/CT: J. Leal, J.H. Oo and L Baker The overall goal of this U01 is to combine quantitative parameters from multiple modalities, in particular PET/CT, SPECT/CT and MRI, to provide a better prediction or assessment of therapeutic response. We will use different tracers in PET and SPECT and advanced MRI methods. In the project we will develop, optimize and validate quantitative imaging-based multiparametric response metrics. Goals Specific Aims Deliverables PET/CT SPECT/CT Aim 1:Optimize and estimate the accuracy and precision of the individual quantitative image-derived parameters from PET/CT, SPECT/CT, and MRI. Optimize protocols, parameters, and imaging methods. Develop methods that use images from one modality to improve images from another modality. Estimate the precision of the imaging-derived parameters including biological and technical variability. Aim 2. Develop methods to optimally combine the multiple parameters obtained from separate imaging studies to provide effective and useful metrics for assessing treatment response. Select the most appropriate and useful quantitative parameters for each application. Develop empirical and statistically-based combined parameters and parametric images. Develop global, tumor, and intra-tumor measures of response. Aim 3. Apply the multiparametric imaging methods developed in Aim 2 to clinical trials. Use FDG and FLT PET/CT in lung cancer chemotherapy. Use SPECT/CT, PET/CT and MRI to predict response of primary brain tumors to anti-angiogenic therapy. FDG-PET/CT, and DCE- and DWI-MRI in breast cancer therapy. Use MRI and SPECT/CT to assess response in neuro-endocrine tumor therapies. We have studied the stability and reproducibility of diffusion weighted imaging (DWI) and apparent diffusion coefficient (ADC) mapping. In addition, we investigated the effect of compression during dynamic contrast enhancement MRI (DCE) in a set of patients undergoing biopsy. We examined the temporal stability and reproducibility of DWI/ADC map metrics on a group of 10 breast patients with a BIRADS score between 2 and 3 (benign-watchful waiting).These patients were evaluated at a minimum of three different time points over a 2 year period with the same equipment (3T) and sequences. The percent differences in contralateral and ipsilateral glandular tissue ADC map values at the different time points ranged from 2.4-6.2% and 2.5-5.3%. Figure 1 is an example of a patient imaged three times one year apart, illustrating the stability. To evaluate the effect of breast compression on breast cancer masses and glandular tissue enhancement in order to understand its effect on the quality of breast MRI in identifying and characterizing breast lesions after DCE MRI. We evaluated 300 MRI examinations of 149 women (age 51.5+10.9) who underwent diagnostic (noncompressed) MRI and MR-guided biopsy (compressed). Breast compression was expressed as %relative to the noncompressed breast. Breast density, type of lesion (mass versus non-mass-like enhancement (NMLE)), lesion size, %compression and kinetic curve type were evaluated. Linear regression, ROC analysis, and kappa test were performed. We found that the %enhancement was higher in noncompressed versus compressed studies in early(145.2+55.5 vs 114.9+38) and delayed (172.8+78.9 vs 139.4+46.4) phases(p<0.001 and 0.06). Among breast lesions 12%(7/59) were significantly smaller when compressed, underestimating the TNM classification(p<0.001). Breast masses (n=42) showed significantly higher early %enhancement(150.6+68.2 versus 120.2+39.9) than NMLE(n=17,p=0.04), and a %enhancement difference(40.5+62 versus 15.8+26.2) (p=0.04). The kinetic curve performance for identifying invasive cancer decreased after compression(AUC=0.48 vs 0.7, p=0.01). Breast compression resulted in complete loss of enhancement of nine (4%) lesions (see Figure 2). Breast compression affected breast lesion detection, size, and DCE MRI interpretation and performance. We recommend limiting the application of breast compression except when clinically necessary. Binary code for performing quantitative SPECT reconstruction, for Tc-99m, I-123, and In-111 labeled agents, ncluding protocols for performing SPECT calibration studies for the above radionuclides. Estimates of repeatability of SPECT SUV max, peak, and Total VOI activity as a function of the VOI size for In-111 Octreoscan. Binary code for performing PET partial volume compensation. Estimates of repeatability of quantitative measurses of SUV max, peak, and total VOI activity (i.e., total lesion glycolysis for FDG). Methods for assessing uptake heterogeneity inside VOIs. Optimization of Diffusion Weighted Imaging at 3T using multiple b values in breast cancer. Estimates of repeatability of quantitative measures of DWI/ADC mapping in normal tissue and malignant tumors Assessment and characterization of breast tumor heterogeneity using multiparametric MRI. Estimates of repeatability of combined PET and MRI data sets obtained as part of test-retest studies Validated methods for combining PET and MRI imaging aimed at predicting response. This will include FDG and FLT PET/Ct for lung cancer chemotherapy and FDG PET and MRI for breast cancer at the patient, tumor, and sub-tumor level. MRI *Eric C. Frey, Ph.D., *Michael A. Jacobs, Ph.D., Martin A. Lodge, Hao Wang, and *Richard L. Wahl, M.D. (*PIs) E The Russell H. Morgan Department of Radiology and Radiological Science, and Sidney Kimmel Comprehensive Cancer Center, Johns Hopkins University, Baltimore, MD, USA In PERCIST 1.0 liver activity in a 3 cm sphere in the liver is used to assess noise, study comparability, and establish a patient-specific disease threshold. To assess variability the liver VOI we evaluated 286 PET/CT scans from multiple centers acquired on 9 different scanner models. The scans included a combination of 2D and 3D acquisitions with and without time-of-flight (TOF). The data showed that the coefficients of variation (COVs) were 14.8±3.1%, 9.4±2.1%, and 8.5±2.9% for 2D, 3D, and 3D w/TOF, respectively. The differences in COV were statistically significant. We also investigated the correlation of the COV with other factors including injected activity, reconstructed volume, height, weight, and VOI; the COV was more strongly associated with acquisition mode that these other factors. The data indicate that taking into account the noise in individual studies may be beneficial in response assessment stratification schemes based on SUL. Tumor heterogeneity has been associated with prognostic outcome and may thus be useful for assessing response. We have developed a novel index of tumor heterogeneity, the Heterogeneity and Irregularity Parameter based on PERCIST (HIPP). In the method the metabolic tumor volume (MTV) is defined by a a region growing algorithm using a threshold equal to: 1.5*Livermean + 2.0*Liverstdev. Figure 3 shows an example of the automatically segmented MTV. The HIPP is equal to the number of independent islands that form after iterative morphological erosion of the MTV. The tumor segmented in Figure 3 has an HIPP of 3. To evaluate this index we retrospectively analyzed baseline FDG studies of 86 patients with Ewing’s Sarcoma from a multicenter trial. We first estimated the ROC curve for for the median survival time of 246 days for various commonly used indices (see Figure 4). Note that HIPP had the higher ROC curve than all the other metrics, indicating that heterogeneity is an important factor in predicting survival. To further investigate utility of HIPP in predicting survival investigated the use of an HIPP > 1 as a predictor of survival we plotted the survival curves for patients with HIPP=1 and HIPP > 1 (see Figure 5). The difference was highly statistically significant (p=0.001) indicating that HIPP may be a useful index of tumor heterogeneity. Acknowledgements Figure 1: Example of a breast exams at 3T with T1, DWI and PK DCE MRI acquired 1 year apart. The similarity of the DWI and ADC maps demonstrates the reproducibility over a long period of time. Figure 2: Example of a vanishing lesion after breast compression.