Download
1 / 44
520 likes | 873 Vues
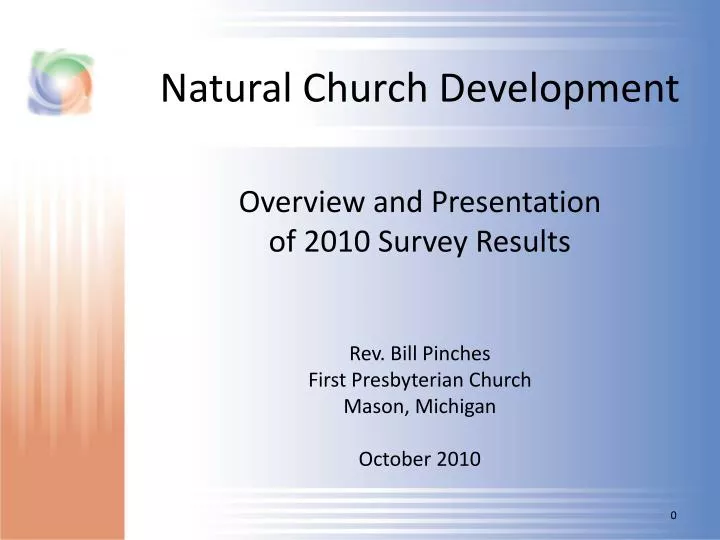
Natural Church Development. Overview and Presentation of 2010 Survey Results Rev. Bill Pinches First Presbyterian Church Mason, Michigan October 2010. Reality Check. PC(USA) Total Membership, 1900 - 2008. Reality Check. Reality Check. In the Presbytery of Lake Michigan:

E N D
Natural Church Development Overview and Presentation of 2010 Survey Results Rev. Bill Pinches First Presbyterian Church Mason, Michigan October 2010
Reality Check PC(USA) Total Membership, 1900 - 2008
Reality Check • In the Presbytery of Lake Michigan: • there are a total of 69 churches (last year, there were 71); • only 9 churches are larger than they were 10 years ago; • only 4 churches have grown by more than 10 people in the last 10 years; • approx. 60 churches are smaller than 10 years ago; • some churches are half the size they were 10 years ago; • and a few churches have closed. • Every presbytery across the country could tell a similar story. These statistics are representative of what is happening across the denomination, nationwide.
Where “Natural Church Development” Originated • The Institute for Natural Church Development was founded in Germany in 1989 (20 years ago) by a young German theologian named Christian Schwarz. • The Institute’s goal: to help churches of all denominations experience qualitative and quantitative growth. • The Institute began studying characteristics in growing churches (note: growing churches, not big churches), looking for consistent patterns that could be found in a variety of different cultures and denominations. • The initial study involved 1000 churches in 32 countries. • Over time, the Institute identified eight characteristics that are routinely present in every congregation - regardless of denomination, country, or culture - that is growing.
What “Natural Church Development” Offers • NCD offers a structured way to take an overall assessment of where our church is right now and to develop clear action plans to move our church towards a higher quality of life and a greater attractiveness to new people. • NCD offers an analysis of the church by measuring eight quality characteristics which are more developed in growing churches than in stagnant and declining churches. • NCD offers us an opportunity for us to take a good, hard look at what’s really going on here, so that we can determine what we in this particular church most need to work on at this particular point in our history to improve the overall health and well-being of this congregation, for the good of everybody involved in the life of the church.
What “Natural Church Development” Offers • Taking an NCD survey is like going to the doctor for an annual physical . . . • . . . or taking a good, hard look in a mirror. • Once you’ve gone to the doctor or looked in the mirror, you have the power and the ability to do something in response to what you have learned. • You could say “Yeah, I’ll deal with that later” . . . • . . . or you could live in denial . . . • . . . or you could ignore what you’re hearing . . . • . . . or you could fail to act out of fear . . . • . . . or you could say, “It’s time to do something about this.” • Which is the healthiest choice?
Overall NCD Results • Churches that have done three or more NCD surveys have seen the following measurable changes between the first and third survey (an average of 31 months): • The quality of the church (in all areas of church life) increased by an average score of 6 points. • deeper prayer • livelier small groups • more loving relationships • more energizing worship • more satisfied commitment • greater attractiveness to people with little or no church background • etc.
Overall NCD Results • Churches that have done three or more NCD surveys have seen the following measurable changes between the first and third survey (an average of 31 months): • The growth rate increased by an average of 51%. • Examples: from 10 new people per year to 15 per year; from 200 new people per year to 300 per year • 1.6 million people have joined the participating churches as a direct consequence of the NCD process. • The focus of NCD is not explicitly evangelistic; the focus is on increasing church health. People are attracted to healthy, high-quality churches.
Overall NCD Results • Churches that have done three or more NCD surveys have seen the following measurable changes between the first and third survey (an average of 31 months): • The percentage of “transfer growth” (people joining from other churches) decreased while the percentage of “conversion growth” (people with little or no prior church experience) increased. • “Transfer growth” does not increase the overall number or percentage of people participating in church life. “Conversion growth” does.
Overall NCD Results • Churches that have done three or more NCD surveys have seen the following measurable changes between the first and third survey (an average of 31 months): • The work load of the participating members decreased significantly. • The number of people agreeing to the statement “Despite my church activities, I have sufficient time for my hobbies” grows by an average of 9.3%. • Those who are personally involved in the church demonstrate a measurably higher level of satisfaction with their church participation.
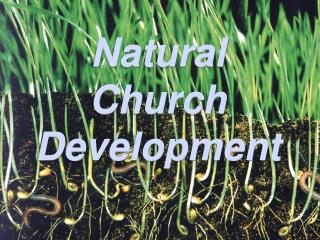
Basic NCD Concepts • “The kingdom of God is as if someone would scatter seed on the ground, and would sleep and rise night and day, and the seed would sprout and grow, he does not know how.” • Jesus (Mark 4:26-27) • “I planted, Apollos watered, but God gave the growth” • the apostle Paul (1 Corinthians 3:6) • NCD is about creating the right conditions in the “soil” (planting, watering) so that growth will occur all by itself.
Quality Characteristic #1:Empowering Leadership • Are church leaders focused on • equipping members for ministry? • Leaders Empower Others. How well do the pastor and leaders delegate and share ministry? • Leadership Fit. Is our pastor free to make decisions and lead the church? • Delegation and Sharing of Ministry. Is this a team effort or a one person show? • Compelling Vision. Are we just maintaining current ministry or are there definable goals?
Quality Characteristic #2:Gift-Based Ministry • Are tasks in your church distributed • according to the criterion of gifting? • Integrating Gifts into Ministry. Do we match people’s gifts to the task they perform in the church? • Significance of Ministry. Do people feel joy in their service or is it an obligation? • Support for Ministry. Does the church leadership support people in their ministry? • Equipping for Ministry. Are people trained for their task?
Quality Characteristic #3:Passionate Spirituality • Is the spiritual life of the church members • characterized by passion? • Experiencing God. What role does my relationship with Christ have in my daily life? • Passion for Church. Not just a passion for the local church, but for Christ’s Church. • Passion for Devotions. How important is the Bible to the way people live their lives? • Spiritual Interconnectedness. How involved in the church are your members?
Quality Characteristic #4:Effective Structures • Do the structures of your church • contribute to growth? • Effective Planning. How do we determine and communicate corporate goals? • Organizational Structure and Systems. What would an organizational chart of our church look like? • Innovation and Managing Change. How does this church encourage and allow creative thinking? • Structure for Effective Leadership. How are leaders appointed and trained? Who do they report to?
Quality Characteristic #5:Inspiring Worship Service • Are your worship services an inspiring • experience for the members? • Personal Transformation in Worship. Do people leave your service feeling better than when they arrived? • Visitor Friendly Church. Do people want to share the worship service with their friends? • Anticipation for Worship. Why do people come to your worship service? • Relevance of Message. Does the sermon address real-life needs of the congregation?
Quality Characteristic #6:Holistic Small Groups • Do the small groups address • the life issues of their members? • Developing Spiritually-Oriented Community. What does group life look like when “God shows up”? • Multiplication of Disciples, Leaders and Groups. Are the groups growing? How fast? • Integrating Newcomers. How effective have your groups been in incorporating new people? • Group Relevance. What makes your small groups a safe place for learning and sharing?
Quality Characteristic #7:Need-Oriented Evangelism • Are the outreach activities related • to the needs of those you are trying to reach? • Compassionate Church. How do you make newcomers feel as if they belong? • Corporate Evangelistic Efforts. How intentional is the leadership at encouraging evangelism? • Personal Evangelism. How well do the people in your congregation do in sharing their faith? • Seeker-Sensitive Church. How do we as a church work together to welcome seekers?
Quality Characteristic #8:Loving Relationships • Are the relationships of the members • characterized by love? • Affirmation and Encouragement. Do we encourage one another? • Atmosphere of Joy and Trust. Are joy and trust present in your church on a weekly basis? • Deepening Relationships. How interconnected are the people in our church? • Conflict Resolution. Is conflict ignored or addressed?
The Scores • 50 is an average score. A totally “average” church would have a score of 50 for all eight quality characteristics. • Scores are plotted on a bell curve: • 5 20 35 50 65 80 95
The Scores • The distribution: • 0.1% of all churches score less than 5. • 2.1% of all churches score between 5 and 20. • 13.6% of all churches score between 20 and 35. • 34.1% of all churches score between 35 and 50. • 34.1% of all churches score between 50 and 65. • 13.6% of all churches score between 65 and 80. • 2.1% of all churches score between 80 and 95. • 0.1% of all churches score greater than 95. • Each of the eight quality characteristics is scored independently from the rest. A church could score very high in certain areas and very low in others.
The Survey • Scores are determined through a survey of 30 active members. These results are compared with NCD’s database of information on 45,000+ churches around the world. • To participate in a survey, church members must: • regularly and faithfully attend worship services; • be involved in some group within the church that meets regularly; and • have some kind of responsibility within the church. • If more than 30 people meet those three criteria (as happened in our case), then survey participants are randomly selected from the people who meet the criteria. • If you didn’t participate in the survey this year, you might have an opportunity in the future survey.
Maximum and Minimum Factors • A church’s “maximum factor” is the quality characteristic with the highest score (the church’s greatest strength). • A church’s “minimum factor” is the quality characteristic with the lowest score (the church’s greatest weakness). • If a church wants to grow, it must improve its minimum factor. It does not matter how strong the other seven areas are. Growing churches develop strengths in all eight areas. • A church always has a minimum factor, no matter how high the scores are. There is always something that can be improved to promote greater church health and vitality. • A big gap between the maximum and minimum factors can lead to the weakening of areas of strength. The minimum factor may pull down the stronger areas.
Our Results! • What do you think our maximum factor might be? • What do you think our minimum factor might be? • Empowering leadership • Gift-based ministry • Passionate spirituality • Effective structures • Inspiring worship service • Holistic small groups • Need-oriented evangelism • Loving relationships
Our Results • Things to celebrate: • Five of our eight scores are above average. • One of our scores is higher than 65 (above the “normal” range). • The average of our eight scores is 52. The average score for most churches just starting the NCD process is about 42. That puts us well above “average” for churches just starting the process. • Things to pay attention to: • Three of our scores are below average. • One score is so low it is almost outside the normal range. • There is a very large gap (29 points) between our maximum and minimum factors.
Our Results • 66: Gift-based ministry (our “maximum factor”) • 57: Loving relationships • 56: Empowering leadership • 56: Holistic small groups • 52: Effective structures • 46: Inspiring worship service • 44: Need-oriented evangelism • 37: Passionate spirituality (our “minimum factor”)
Our Results • Subcategories within our maximum factor, Gift-based ministry: • 74: Integrating gifts into ministry • 67: Significance of ministry • 67: Support for ministry • 52: Equipping for ministry • Subcategories within our minimum factor, Passionate spirituality: • 47: Passion for Church • 46: Experiencing God • 32: Spiritual Interconnectedness • 31: Passion for Devotions
Where We Go From Here • The next step: Focus Groups • The big questions: Why is Passionate Spirituality our minimum factor? What would be causing that? • When we know the answer to those questions, we’ll begin to have an idea what we need to do to fix it. . . .