Download

1 / 50
540 likes | 801 Vues
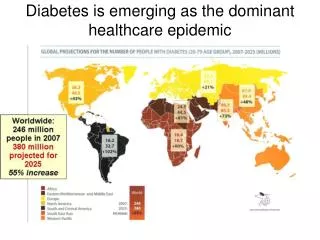
DIABETES THE NEW EPIDEMIC. 3rd June 2014 Professor Paolo Pozzilli. In collaboration with Rocky Strollo and Valentina Greto. Number of people with diabetes (20-79 years ), 2013. Tot: 382 ,000,000 in 2013 Tot: 471 ,000,000 in 2035. IDF Diabetes Atlas, 6th Edition, 2013.

E N D
DIABETESTHE NEW EPIDEMIC 3rd June 2014 Professor Paolo Pozzilli In collaboration with Rocky Strollo and Valentina Greto
Number of people with diabetes(20-79 years), 2013 Tot: 382,000,000 in 2013 Tot: 471,000,000 in 2035 IDF Diabetes Atlas, 6th Edition, 2013
Trends in age-standardizeddiabetesprevalence by regions in MALES (1980-2008) High income regions Europe/North America Central/Eastern Europe Sub-Saharan Africa Oceania 20 16 12 8 4 World Central Asia, North Africa, Middle-East South Asia East Asia and SE Asia 20 16 12 8 4 Diabetes Prevalence (%) 1985 1995 2005 Central/Andean America High income Asia Southern America 20 16 12 8 4 Danaei et al. Lancet 2011 1985 1995 2005 1985 1995 2005 1985 1995 2005
Trends in age-standardizeddiabetesprevalence by regions in FEMALES (1980-2008) Oceania High income regions Europe/North America Central/Eastern Europe Sub-Saharan Africa 20 16 12 8 4 World Central Asia, North Africa, Middle-East South Asia East Asia and SE Asia 20 16 12 8 4 Diabetes Prevalence (%) 1985 1995 2005 Central/Andean America High income Asia Southern America 20 16 12 8 4 Danaei et al. Lancet 2011 1985 1995 2005 1985 1995 2005 1985 1995 2005
Increasedprevalence of diabetes in children and adolescents Results from prescription data from a UK general practice database Overall prevalence of antidiabetic drug use in children and adolescents by age on IMS, 1998-2005 inclusive girls boys and overall Hsia Y et al., British Journal of Clinical Pharmacology, 2008
Increasing use of antidiabeticdrugsamongchildren and adolescents * * * Prevalence of insulin, oral antidiabetic and oral antidiabetic drugs with a diabetes indication amongst children and adolescents aged 0-18 (with 95% CIs), insulin oral antidiabetic drugs oral antidiabetic drugs with diabetes indication ; *a significant trend for increasing use (p< 0.001). Hsia Y et al., British Journal of Clinical Pharmacology, 2008
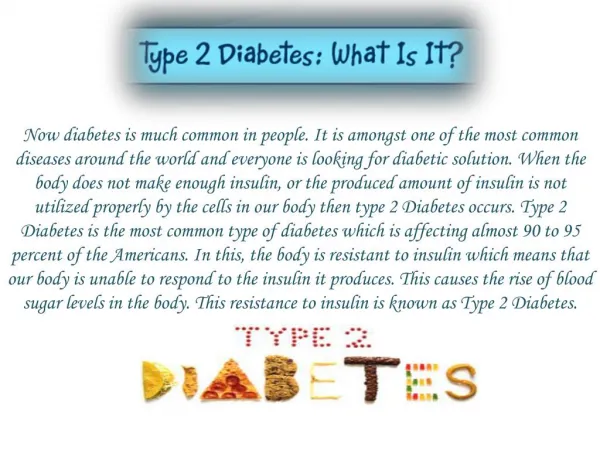
Type 1 diabetes (15%) It is caused by an autoimmune reaction, where the body’s defence system attacks the insulin-producing beta cells in the pancreas. The body can no longer produce the insulin that it needs. Type 2 diabetes (85%) It is the most common type of diabetes. It usually occurs in adults, but it is increasingly seen in children and adolescents. The body is able to produce insulin but either this is not sufficient or the body is unable to respond to its effects.
Projections of the number of individuals aged <20 years with type 1 diabetes –2010 to 2050 in the US population A global increase of 23% 2050 2010 TOT = 179,388 TOT = 587,488 Imperatore et al. Diabetes Care 2012
Projections of the number of individuals aged <20 years with type 2 diabetes –2010 to 2050 in the US population A global increase of 49% 2010 2050 TOT = 22,820 TOT = 84,131 Imperatore et al. Diabetes Care 2012
Prevalence of type 2 diabetes in urban and rural areas in the Arabic-speaking countries, 2011 Badran M and Laher I, International Journal of Endocrinology, 2012
Type 2 diabetesprevalence in South Africa, 2009 Betram MY et al., Global Health Action 2013
Prevalence of type 2 diabetes in Asian countries in 2013 data source: http://www.idf.org/diabetesatlas/data-visualisations Abdullah N et al., International Journal of Endocrinology, 2014
Whydid type 2 diabetesbecomepandemic?
Worldwide prevalenceofobesity Source: World Health Organization (WHO), 2012
Obesity prevalence is high in developing countries Prevalence of obesity in Arabian countries in adult males and females aged between 15 and 100 years, WHO estimates, 2010. Badran M et al., Journal of Obesity, 2011
Obesityprevalence in adults (Italy), 2011 Trentino 7.5% Lombardia 8.9% Valle d’Aosta 8,3% Friuli-V.G. 11.8% Piemonte 9.1% Veneto 9.9% Liguria 8.3% E.Romagna 12.0% Marche 9.6% Toscana 8.7% Abruzzo 8.7% Umbria 11.2% Molise 13.5% Lazio 9.2% Puglia 12.6% Campania 10.9% Sardegna 10.2% Basilicata 13.1% Calabria 11.4% Sicilia 9.8% Source: ISTAT 2013
Percentage of US adultswhowere obese or diagnosedwithdiabetes Obesity (BMI 30 KG/m2) Diabetes Centre for Disease Control and Prevention: National Diabetes Surveillance System http://apps.nccf.cdc.gov/DDTSTRS/default.aspx. Accessed March 2013
Obesityprevalenceremains high altough no significantchangesbetween 2003-2012 9120 participants in the 2011-2012 nationally representative National Health and Nutrition ExaminationSurvey Childhood obesity (2-19 years) Adult obesity (>20 years) Ogden et al. JAMA 2014
Type 2 diabetesprevention: WHEN? the preventionwindow
Progression of disease Insulin resistance Hepatic glucose production Insulin level β-cell function 4–7 years Post-prandial glucose Fasting glucose Impaired Glucose Tolerance Frank Diabetes Diabetes Diagnosis Natural history of type 2 diabetes
Combinedimpairedfastingglucose (IFG) + impairedglucosetolerance (IGT) confers the highestrisk of diabetesprogression Relative Risk (95% CI) Isolated IGT Isolated IFG Metanalysis of total risk of pre-diabetes and diabetesprogression, based on 21 cohortstudies and 9 RCT (follow-up: 1-17 years) Gerstein HC et al. Diabetes Research and Clinical Practice 2007
Prediabetesincreases the risk for cardiovascularevents and death Relative risk of deathis linear by 2h-PG – DECODE study DECODE study group. Lancet 1999
Pathophysiological defects in type 2 diabetes β-Cell dysfunction Insulin resistance Increased glucose production by liver Kahn CR et al. Joslin’s Diabetes Mellitus. 14th ed. Lippincott Williams & Wilkins; 2005
Loss of first phaseinsulinsecretion in type 2 diabetes 800 600 normal Insulin secretion (pmol/min) 400 Type 2 diabetes 200 breakfast lunch dinner 0 6.00 10.00 14.00 18.00 22.00 2.00 6.00 time Polonsky KS et al. N Engl J Med, 1988
-cell mass: decline over diabetes continuum -cell function Insulin resistance The United Kingdom Prospective Diabetes Study (UKPDS) 100 2 80 60 Insulin resistance Beta cell function (%) 1 40 20 P < 0.0001 0 0 –10 –9 –8 –7 –6 –5 –4 –3 –2 –1 1 2 3 4 5 6 Timing to diagnosis (years) HOMA model, diet-treated n = 376 Holman RR et al. Diabetes Res Clin Pract 1998
-cell mass is already impaired at the diagnosis of type 2 diabetes -50% -cell mass (%) -63% Type 2 diabetes Type 2 diabetes Lean Obese Butler AE et al. Diabetes 2003; Leslie RDePozzilli P, J Clin Endocrinol Metab 2006
Oral hypoglycemic agents targeting the pathophysiologic defects in type 2 diabetes Pancreas Impaired insulin secretion Sulfonylureas Muscle and fat Meglitinides DPP-4 inhibitors GLP1 analogues Liver ↓Glucose level Insulinresistance Hepatic glucoseoverproduction Gut TZDs Metformin Metformin TZDs DPP-4 inhibitors GLP1 analogues α-Glucosidase inhibitors Metformin Glucose absorption
What’s evidencethattype 2 diabetes can be prevented or delayed?
Lifestyleintervention can preventtype 2 diabetesdevelopment DPS, Finnish Diabetes Prevention Study; DPP, Diabetes Prevention Program; IDPP, Indian Diabetes Prevention Program
Incidence of Diabetes in the DPP trial Placebo (n=1082) Metformin (n=1073, p<0.001 vs. Placebo) Lifestyle (n=1079, p<0.001 vs. Metformin , p<0.001 vs. Placebo) Risk reduction 31% by metformin 58% by lifestyle The DPP Research Group, NEJM 346:393-403, 2002
Pharmacologicalintervention to preventtype 2 diabetes * Odds Ratio; IGR, Impaired glucose regulation; GI, Gastro-intestinal.
The STOP-NIDDM: Acarbose • Acarbose reduced risk of new • Hypertension >140/90; 5.3% absolute risk reduction (P=0.006) • Myocardial infarction (P=0.02) • Any CVD event: CHD, CV death or stroke, CHF, PVD (P=0.03) Acarbose100 mg TIDn=682 Placebon=686 25% Relative Risk Reduction P=0.0022 Chiasson JL, et al. Lancet. 2002;359(9323): 2072-2077;Chiasson JL, et al. JAMA. 2003;290(4):486-494.
ACT NOW: Pioglitazone • Pioglitazone reduced risk of type 2 diabetes by 72% vs. placebo (HR 0.28; 95% CI 0.16–0.49 P<0.001) • Conversion to normal glucose tolerance: 48% of patients with pioglitazone vs 28% with placebo (P<0.001) • Pioglitazone reduced fasting glucose,2-hour glucose, HbA1c • Weight gain, edema observed in the pioglitazone arm DeFronzo RA, et al, for the ACT NOW Study. N Engl J Med. 2011
ORIGIN: Insulin glargine Gernstein et al. NEJM 2012
Sustained effect of lifestyle intervention Diabetes Prevention Study 3-years post-intervention follow-up DaQing 20-years post-intervention follow-up study Lindstrom J et al. Lancet 2006 Li G et al. Lancet 2008
DPP: Metformin had sustained effect after drug washout • Brief (1-2 week) drug washout study at end of Diabetes Prevention Program trial • After washout, diabetes was more frequently diagnosed in metformin vs. placebo (1.49; 0.93, 2.38; P=0.098) • DPP primary analysis: metformin decreased diabetes risk by 31% • Washout: 26% accounted for by pharmacological effect of metformin • Postwashout: diabetes reduced by 25% Diabetes Prevention Program Research Group. Diabetes Care. 2003;26:977-980.
Summary of lifestyle/ pharmacological interventions Lifestyle intervention continues to have an effect; most drugs do not Lifestyle Pharmacologic
Dietary intake keep increasing… Grains and fats account for nearly all of the increasein daily calorie consumption since 1970 Source: Food and Agriculture Organization of the United Nations
… while price of food, adjusted for inflation, has dropped The price of added sugars has dropped significantly more than the price of healthful foods -50% +30% -38% 0% -38% -29% -50% Source: USDA's Economic Research Service
Taxing unhealthy food and drinks to improve health? Examples of Health-related food taxes Mytton et al. BMJ 2012
Junk food taxes might reduce energy intake, weight and insulin levels over time 20 years longitudinal study (CARDIA study) on 5,115 young adults * and e, P<0.05 Duffey et al. Arch Intern Med 2010
Financial Incentive–Based Approaches for Weight Loss • 57 healthy subject 30-70 years, BMI 30-40, were randomized to 3 weight loss plans: • Monthly weigh-ins, • 2) LOTTERY incentive program: participants played a lottery and received the earnings if they achieved or lost more than the target weight • 3) DEPOSIT incentive: participants • invested their own money, which they • lost if they failed to achieve weight • goals. • 16 weeks follow-up The use of economic incentives produced significant weight loss (more than the control group) during the 16 weeks of intervention that was not fully sustained (Volpp et al. JAMA 2008)
Financial incentives for weight loss: group-based incentives are more effective than individual incentives Control group Individual-incentivegroup* Group-incentivegroup** Change in weight from baseline (lb) Week 105 obese employers (BMI 30-40) randomized to and followed up to 24 weeks: *INDIVIDUAL INCENTIVE: $100 per person per month for meeting or exceeding weight-loss goals **GROUP INCENTIVE: $500 per month split among participants within groups of 5 who met or exceeded weight-loss goals CONTROL GROUP Kullgren et al. Ann Intern Med 2013
Peer mentoring and financial incentives for blood glucose control 118 African Americans veterans assinged to the following three groups and followed-up to 6 months: 1)USUAL CARE 2)PEER MENTOR Patients were assigned a mentor who formerly had poor glycemic control but now had good control (HbA1c level 7.5%). The mentor was asked to talk with the patient at least once per week. Peer mentors were matched by race, sex, and age. 3)FINANCIAL INCENTIVES - $100 by decreasing HbA1c by 1% - $200 by decreasing HbA2c by 2% or to an HbA1c 6.5%. Peer mentorship improved glucose control in a cohort of African American veterans with diabetes. (Long et al. Annals of Int Med 2012)
Call for Action • We must identify patients at highest risk (prediabetes) • Modest lifestyle changes are most effective • Sustain interventions • Increase opportunities for community programs to support prevention • Delaying or preventing type 2 diabetes is cost-effective and will help turn the tide on the diabetes epidemic • “Health-taxes” for improving adherence to healthy lifestyle or reducing calorie intake might be considered
A possible approach to tackle the diabetes epidemic Low Adherence Detect and tackle barriers Lifestyle intervention Good Adherence Easy to deliver Sustained effect Low cost “BMI taxes” or “BMI prize” “Blood glucose taxes” or “Blood glucose prize” Junk food taxes Obesity Normal blood glucose Pre-diabetes Diabetes Lifestyle Genetic background