Download
1 / 13
130 likes | 256 Vues
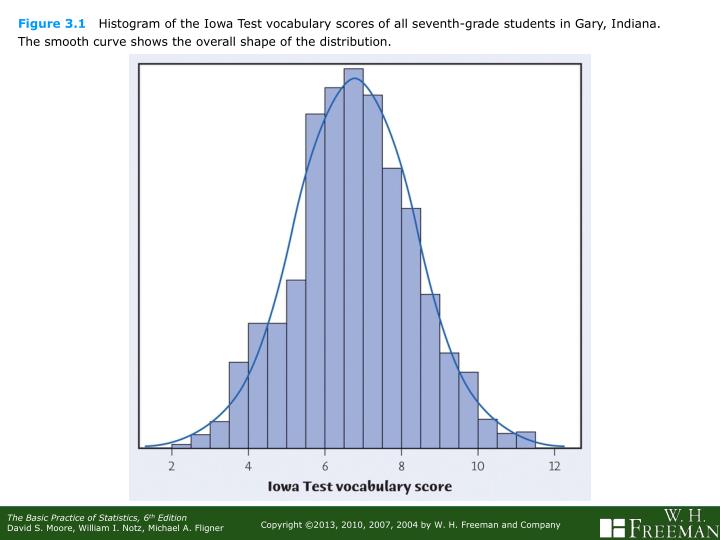
Figure 3.1 Histogram of the Iowa Test vocabulary scores of all seventh-grade students in Gary, Indiana. The smooth curve shows the overall shape of the distribution. Figure 3.2a The proportion of scores less than or equal to 6.0 in the actual data is 0.303.

E N D
Figure 3.1 Histogram of the Iowa Test vocabulary scores of all seventh-grade students in Gary, Indiana.The smooth curve shows the overall shape of the distribution.
Figure 3.2a The proportion of scores less than or equal to 6.0 in the actual data is 0.303.
Figure 3.2b The proportion of scores less than or equal to 6.0 from the density curve is 0.293. The density curve is a good approximation to the distribution of the data.
Figure 3.4 The density curve for the location of accidents along a 5-mile bike path, for Exercise 3.2.
Figure 3.5a The median and mean of a symmetric density curve both lie at the center of symmetry.
Figure 3.5b The median and mean of a right-skewed density curve. The mean is pulled away from the median toward the long tail.
Figure 3.8 Two Normal curves, showing the mean m and standard deviation s.
Figure 3.9 The 68–95–99.7 rule for Normal distributions.
Figure 3.10 The 68–95–99.7 rule applied to the distribution of Iowa Test scores for seventh-grade students in Gary, Indiana, for Example 3.2. The mean and standard deviation are m = 6.84 and s = 1.55.