Download

1 / 33
330 likes | 450 Vues
Introduction to the FIA Down Woody Materials Indicator 1st of 3 Part Training Series. Christopher Woodall DWM National Indicator Advisor. Outline. Indicator Updates What are Down Woody Materials? Why Collect DWM data? Sampling Design Theory. Indicator Updates. No sample protocol changes

E N D
Introduction to the FIA Down Woody Materials Indicator1st of 3 Part Training Series Christopher Woodall DWM National Indicator Advisor
Outline • Indicator Updates • What are Down Woody Materials? • Why Collect DWM data? • Sampling Design Theory
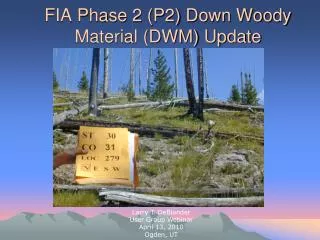
Indicator Updates • No sample protocol changes • Field manual updated in 2004 • Web-site updated • DWM sample design and analysis in press – NC-GTR-256 • Web-based dissemination of data and wider use of data
Definition of DWM Dead material within forests in various stages of decay such as fallen trees, branches, and leaf litter The FIA program places numerous forest ecosystem components into the DWM Indicator
DWM Components Coarse Woody Debris Duff Fine Woody Debris Shrubs/ Herbs Slash Litter
Duff and Litter “dead plant material on forest floor surface” “unrecognizable plant parts”
Slash/Residue Piles Piles of CWD
Shrub and Herbs “Live and dead shrubs/herbs including grass, herbaceous woody plants, and vines”
Fuelbed “Depth of the fuel’s complex, from forest floor to the tallest fuel component”
Why collect DWM data? • Indicator of Forest Health • Wildlife Habitat • Fuels Estimation • Carbon Estimation • Completes Life Cycle of Trees
Indicator of Forest Health Crown Condition Soils Ozone Injury Down Woody Materials Lichens Vegetation Structure and Diversity Tree Damage
Wildlife The DWM Inventory describes the amount and condition of wildlife habitat through estimation of coarse woody debris attributes.
Wildlife Mean estimates of CWD volumes for forests of the North Central Region
Wildlife Proportions of coarse woody debris pieces per acre by transect diameter (A) and decay class (B) (1=least decayed, 5=most decayed), Indiana, 2001-2003
Fuels 1-hr 10-hr 100-hr Total Fine Woody Debris
Fire Science Estimates for DWM in Boundary Waters Canoe Area Compared to rest of region
Carbon Estimation Estimates of Regional Carbon Pools for Coarse Woody Debris Estimates for International Treaties and Criterion Indicators
DWM and National Inventory Completes inventory of trees from living, to dead, to decomposed Microplot Sapling Sub-plot Tree Sub-plot Standing Dead DWM Down and Dead
DWM Sampling Theory DWM diversity requires a diversity of sampling methods
Sampling on the Sub-Plot Slash Piles 2 Similar to sampling phase two trees, if a center of a slash pile coincides with a subplot it is considered an “in” slash pile Microplot N Subplot 1 4 3
Sampling on the Sub-Plot “out” slash pile “in” slash pile Slash piles are sampled across all four subplots FIA Subplot
Sampling on the Microplot In order to estimate shrub/herb heights and coverage for forests (fuel ladders) estimate shrub/herb heights and coverage occurring on micro-plot 6.8 ft Radius
Depth Estimates on Subplot Litter In order to estimate depth of duff, litter, and the fuelbed on a subplot… Duff 12 sample points located for measurement on subplots Fuelbed
Depth Estimates on Subplots 2 Sample Locations 1 4 3
Transect Sampling FWD and CWD pieces are not all counted within a given area rather… All FWD and CWD pieces that intersect a sampling plane are tallied
Transect Sampling Probability of match stick intersecting randomly placed line related to number of sticks and length of line
Transect Sampling Planes DWM Sample Protocol establishes 6 foot tall sampling transects that radiate from FIA subplot centers to intersect fine woody pieces
CWD and FWD Transects Use 3 transects established on each subplot to sample CWD, one transect on each subplot to sample FWD
Conclusions • The DWM indicator estimates numerous ecosystem components • Data Crucial to Fire, Carbon, and Wildlife Sciences • Integral Part of National FIA Program, Completes Tree Life Cycle • Series of different sampling techniques for estimation of various DWM components applied to phase two plots