Download
1 / 34
340 likes | 504 Vues
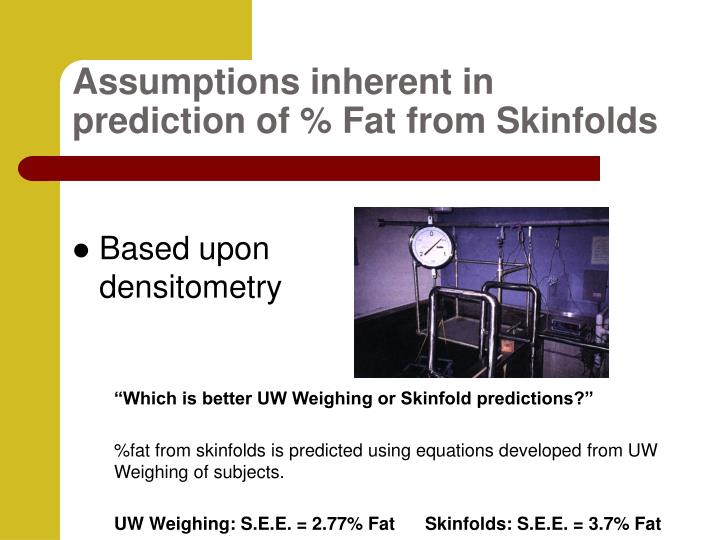
Assumptions inherent in prediction of % Fat from Skinfolds. Based upon densitometry. “Which is better UW Weighing or Skinfold predictions?” %fat from skinfolds is predicted using equations developed from UW Weighing of subjects.

E N D
Assumptions inherent in prediction of % Fat from Skinfolds • Based upon densitometry “Which is better UW Weighing or Skinfold predictions?” %fat from skinfolds is predicted using equations developed from UW Weighing of subjects. UW Weighing: S.E.E. = 2.77% Fat Skinfolds: S.E.E. = 3.7% Fat
Assumptions inherent in prediction of % Fat from Skinfolds • Constant Skinfold Patterning • Constant Skinfold Compressibility • Constant Tissue Densities • Constant Ratio of external/internal adipose tissue • Constant Fat (lipid) content of adipose tissue
YUHASZ Male: % Fat = 0.1051(Sum 6 SF) + 2.585 Female: % Fat = 0.1548(Sum 6 SF) + 3.580 Canadian University Students Can never give a negative answer. What if weight alone changes or is different?
Durnin & Womersley • Density = a (log10Sum 4 SF) + c • Overpredicts by 3 - 5% Fat • British (left side) • Age and gender specific equations • Upper body sites • Electronic Skinfold Caliper
Ultrasound High Frequency Sound (6 MHz) Some sound reflected at tissue interfaces Time taken for return of sound used to estimate distance based upon assumed speed of sound in that tissue
% Fat prediction from Ultrasound • Regression equations predicting densitometrically determined % Fat • S.E.E.’s comparable to skinfold predictions • Beware of “predict anything from anything” once it is in a computer
RADIOGRAPHY • Measurements from radiographs • uncompressed tissue thicknesses • Regression equations predicting densitometrically determined % Fat • Not used any more due to possible negative health consequences
BIOELECTRICAL IMPEDANCE ANALYSIS (BIA) • BIA measured by passing a microcurrent through the body • % Fat predicted from sex, age, height, weight & activity level + BIA • Influenced by hydration level • Claims that you can guess % fat more accurately
Typical BIA Equations • Males • FFM = -10.68 + 0.65H2/R + 0.26W + 0.02R • Females • FFM = -9.53 + 0.69H2/R + 0.17W + 0.02R • Where • FFM = fat free mass (kg) • H = height (cm) • W = body weight (kg) • R – resistance (ohms) • % BF = 100 x (BW-FFM)/BW
BIA Protocol • Very sensitive to changes in body water • normal hydration • caffeine, dehydration, exercise, edema, fed/fasted • Sensitive to body temperature • Avoid exercise • Sensitive to placement of electrodes • conductor length vs. height
Near Infra-Red Spectrophotometry (NIR)FUTREX • Near Infra-Red light emitted from probe • Reflected light monitored • Changes due to differing optical densities • Influenced by hydration • Relative fat may be useful
DEXA, DXADual Energy X-ray Absorptiometry • Two different energy level X-rays • Lean, fat, and bone mass each reduce (attenuate) the X-ray signal in unique ways • Whole body • Regional • Osteoporosis
BMI = 12.6 %Fat = 3.2% BMI = 23.7 %Fat = 48.1% BMI = 18.1 %Fat = 23.1%
What DEXA Measures • Fat and fat-free mass (based upon the standards) • Bone Mineral Mass • Regional results for the above
DEXA Cannot Measure... • Protein Mass • 3-D Fat Distribution • Hydration Status • Tissue inside bone (brain, marrow, blood)
Next generation of Body Composition Models • Two compartment plus • Water • Bone mineral • Protein • 3 or 4 compartment models now regarded as the reference standard rather than underwater weighing
There can be no direct validation • Measure subjects with technique to get % fat then kill them, blend them and dissolve out lipid • Validation of Indirect techniques is by comparison to other Indirect techniques • Which analysis indicates validity • Correlation • Test of Difference of means between tests • Linear regression – slope of unity • Standard Error of Estimate How do you validate these techniques?
Regression Equationsto Predict % Body Fat Y = mX + c Y = % Body Fat X = Anthropometric measure (Skinfolds etc) Correlation Coefficient (r) Standard Error of Estimate (SEE)
Predicting % Fat from Density ASSUMPTIONS Body can be divided into two components: Fat & Non-Fat (Fat Free) Masses Each has different, known and constant densities
SIRI EQUATION Assumptions: Density of FAT MASS 0.9 gm/ml Density of NON-FAT MASS 1.1 gm/ml Equation: % Fat = (4.95/Density)-4.5) x 100
BROZEK EQUATION Assumptions: Density of FAT MASS 0.9 gm/ml Density of LEAN BODY MASS 1.095 gm/ml (some essential lipids in Lean Body Mass) Equation: % Fat = (4.57/Density)-4.142) x 100
Error in Prediction of % Fat Standard Error of Estimate for % Fat from Densitometry S.E.E. = 2.77% Body Fat due to variation in density of fat free mass Example: predicted value = 15% Body Fat 95% confidence in true value = 15 ± 1.96 x S.E.E. = 15 ± (1.96 x 2.77) = 9.57% - 20.43%
Obvious Errors In 9 of 29 measured, the density of FFM was clearly not 1.1 gm/ml
Variability of Constants • The existence of this table infers that we should know the precise density of FFM. • However, using arbitrary cut-offs between age groups merely highlights the problem
“SEEs ranged from 2.4% to 3.5% BF”? • “which were distributed among the good, very good, and excellent categories, as subjectively assessed by Lohman (1992)” • SEE = 4.1% BF gives • 95% confidence of ± 1.96 x 4.1%BF • 95% confidence of ± 8%BF !!!!!! BODPOD vs DEXAFields et al. 2002
The New York Obesity Research Center • The assumed density of 1.1 g/cm3 is based on observations made in a limited number of human cadavers suggesting relatively stable proportions of water, protein, glycogen and minerals. To the extent that these proportions change in any individual subject will introduce corresponding errors in the assumed density of fat-free mass. • A number of studies suggest that the density of fat-free mass is relatively stable across age and sex groups, although some variation is recognized at the extremes of age and in patients who have underlying medical and surgical conditions. NOT TRUE!!! • Additionally, there may exist race differences in the density of fat-free mass as well as variation among special groups such as body builders or other types of athletic participants. Thus, while underwater weighing and the two-compartment model served as a reference technique for several decades, newer approaches without these various assumptions are now replacing hydrodensitometry as the clinical reference method. MISLEADING!!!
Beware of Garbage • BIA (Bioelectrical Impedance) - The only method that is based on measuring something, not estimating anything, is Bio-Impedance measurement. Bio-Impedance is a means of measuring electrical signals as they pass through the fat, lean mass, and water in the body. Through laboratory research we know the actual impedance or conductivity of various tissues in the body, and we know that by measuring current between two electrodes and applying this information to complex proven scientific formulas accurate body composition can be determined. The fact that the measurement is based on a reading of lean mass and not an estimate of fat mass, lends to a much more comprehensive testing method and results.