Download
1 / 101
1.01k likes | 1.14k Vues
MGMT 276: Statistical Inference in Management Winter, 2013. Welcome. Green sheet. http://www.youtube.com/watch?v=Ahg6qcgoay4&watch_response. Please start portfolios. Schedule of readings. Study guide is online. Before next exam: Monday Please read: • Supplemental reading (Appendix D)

E N D
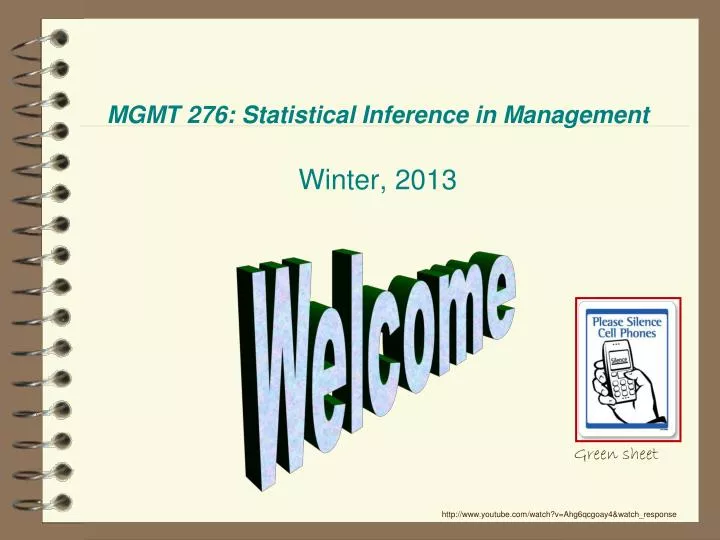
MGMT 276: Statistical Inference in ManagementWinter, 2013 Welcome Green sheet http://www.youtube.com/watch?v=Ahg6qcgoay4&watch_response
Please start portfolios
Schedule of readings Study guide is online • Before next exam: Monday • Please read:• Supplemental reading (Appendix D) • • Supplemental reading (Appendix E) • • Supplemental reading (Appendix F) • 1 - 4 in Lind • Please read Chapters 1, 5, 6 and 13 in Plous • Chapter 1: Selective Perception • Chapter 5: Plasticity • Chapter 6: Effects of Question Wording and Framing • Chapter 13: Anchoring and Adjustment
Use this as your study guide By the end of lecture today12/27/13 Dot Plots Frequency Distributions - Frequency Histograms Frequency, cumulative frequency Relative frequency, cumulative relative frequency guidelines for constructing frequency distributions Shapes of frequency histograms Interpreting skewed and multimodal curves Frequency polygons and ogives Pareto charts Stacked Bar Charts Simple Line Charts Pie Charts Scatterplots Correlation Positive versus negative Strong versus weak versus perfect Correlation does not imply causation Linear versus curvilinear
Simple random sampling: each person from the population has an equal probability of being included Sample frame = how you define population Let’s take a sample …a random sample Question: Average weight of U of A football player Sample frame population of the U of A football team Pick 24th name on the list Random number table – List of random numbers Or, you can use excel to provide number for random sample =RANDBETWEEN(1,115) Pick 64th name on the list(64 is just an example here) 64
Systematic random sampling: A probability sampling technique that involves selecting every kth person from a sampling frame You pick the number Other examples of systematic random sampling 1) check every 2000th light bulb 2) survey every 10thvoter 3) measure every 7th football player
Stratified sampling: sampling technique that involves dividing a sample into subgroups (or strata) and then selecting samples from each of these groups - sampling technique can maintain ratios for the different groups Average number of speeding tickets 12% of sample is from California 7% of sample is from Texas 6% of sample is from Florida 6% from New York 4% from Illinois 4% from Ohio 4% from Pennsylvania 3% from Michigan etc Average cost for text books for a semester 17.7% of sample are Pre-business majors 4.6% of sample are Psychology majors 2.8% of sample are Biology majors 2.4% of sample are Architecture majors etc
Cluster sampling: sampling technique divides a population sample into subgroups (or clusters) by region or physical space. Can either measure everyone or select samples for each cluster Textbook prices Southwest schools Midwest schools Northwest schools etc Average student income, survey by Old main area Near McClelland Around Main Gate etc Patient satisfaction for hospital 7th floor (near maternity ward) 5th floor (near physical rehab) 2nd floor (near trauma center) etc
Non-random sampling is vulnerable to bias Convenience sampling: sampling technique that involves sampling people nearby. A non-random sample and vulnerable to bias Snowball sampling: a non-random technique in which one or more members of a population are located and used to lead the researcher to other members of the population Used when we don’t have any other way of finding them - also vulnerable to biases Judgment sampling: sampling technique that involves sampling people who an expert says would be useful. A non-random sample and vulnerable to bias
You’ve gathered your data…what’s the best way to display it??
Describing Data Visually Lists of numbers too hard to see patterns 14 17 20 25 21 29 16 25 27 18 16 13 11 21 19 24 20 11 20 28 16 13 17 14 14 16 8 17 17 11 11 14 17 19 24 8 16 12 25 9 20 17 11 14 16 18 22 14 18 23 12 15 10 13 15 11 11 8 11 14 17 19 24 8 12 14 17 20 25 9 12 15 17 20 25 10 13 15 17 20 25 11 13 16 17 20 27 11 13 16 17 21 28 11 14 16 18 21 29 11 14 16 18 22 11 14 16 18 23 11 14 16 19 24 Organizing numbers helps Graphical representation even more clear This is a dot plot
Describing Data Visually 8 12 14 17 19 24 8 12 14 17 20 25 9 13 15 17 20 25 10 13 15 17 20 25 11 13 16 17 20 27 11 13 16 17 21 28 11 14 16 18 21 29 11 14 16 18 22 11 14 16 18 23 11 14 16 19 24 Measuring the “frequency of occurrence” Then figure “frequency of occurrence” for the bins We’ve got to put these data into groups (“bins”)
Frequency distributions Frequency distributions an organized list of observations and their frequency of occurrence How many kids are in your family? What is the most common family size?
Another example: How many kids in your family? Number of kids in family 1 3 1 4 2 4 2 8 2 14 14 4 2 1 4 2 3 2 1 8
Frequency distributions Number of kids in family 1 3 1 4 2 4 2 8 2 14 How many kids are in your family? What is the most common family size? Crucial guidelines for constructing frequency distributions: 1. Classes should be mutually exclusive: Each observation should be represented only once (no overlap between classes) Wrong 0 - 5 5 - 10 10 - 15 Correct 0 - 4 5 - 9 10 - 14 Correct 0 - under 5 5 - under 10 10 - under 15 2. Set of classes should be exhaustive: Should include all possible data values (no data points should fall outside range) Correct 0 - 3 4 - 7 8 - 11 12 - 15 Wrong 0 - 3 4 - 7 8 - 11 No place for our family of 14!
Frequency distributions Number of kids in family 1 3 1 4 2 4 2 8 2 14 How many kids are in your family? What is the most common family size? 3. All classes should have equal intervals (even if the frequency for that class is zero) Correct 0 - 4 5 - 9 10 - 14 Wrong 0 - 4 8 - 12 14 - 19 Correct 0 - under 5 5 - under 10 10 - under 15 missing space for families of 5, 6, or 7 4. Class width should be round (easy) numbers • 5. Try to avoid open ended classes • For example • 10 and above • Greater than 100 • Less than 50
Let’s do one Scores on an exam 82 58 64 80 75 72 87 73 88 94 84 78 93 69 70 60 53 84 76 87 84 61 89 95 87 91 75 99 53 58 60 61 64 69 70 72 73 75 75 76 78 80 82 84 84 84 87 87 87 88 89 91 93 94 95 99 Step 1: List scores Step 2: List scores in order Step 3: Decide whether grouped or ungrouped If less than 10 groups, “ungrouped” is fine If more than 10 groups, “grouped” might be better How to figure how many values Largest number - smallest number + 1 99 - 53 + 1 = 47 Step 4: Generate number and size of intervals (or size of bins) If we have 6 bins – we’d have intervals of 8 Sample size (n) 10 – 16 17 – 32 33 – 64 65 – 128 129 - 255 256 – 511 512 – 1,024 Number of classes 5 6 7 8 9 10 11 Let’s just try it and see which we prefer… Whaddya think? Would intervals of 5 be easier to read?
Scores on an exam 82 58 64 80 75 72 87 73 88 94 84 78 93 69 70 60 53 84 76 87 84 61 89 95 87 91 75 99 Scores on an exam Score Frequency 93 - 100 4 85 - 92 6 77- 84 6 69 - 76 7 61- 68 2 53 - 60 3 Scores on an exam Score Frequency 95 - 99 2 90 - 94 3 85 - 89 5 80 – 84 5 75 - 79 4 70 - 74 3 65 - 69 1 60 - 64 3 55 - 59 1 50 - 54 1 53 58 60 61 64 69 70 72 73 75 75 76 78 80 82 84 84 84 87 87 87 88 89 91 93 94 95 99 Let’s just try it and see which we prefer… 6 bins Interval of 8 10 bins Interval of 5 Scores on an exam Score Frequency 95 - 99 2 90 - 94 3 85 - 89 5 80 – 84 5 75 - 79 4 70 - 74 3 65 - 69 1 60 - 64 3 55 - 59 1 50 - 54 1 Remember: This is all about helping readers understand quickly and clearly.
Scores on an exam 82 58 64 80 75 72 87 73 88 94 84 78 93 69 70 60 53 84 76 87 84 61 89 95 87 91 75 99 Scores on an exam Score Frequency 95 - 99 2 90 - 94 3 85 - 89 5 80 – 84 5 75 - 79 4 70 - 74 3 65 - 69 1 60 - 64 3 55 - 59 1 50 - 54 1 Let’s make a frequency histogram using 10 bins and bin width of 5!!
Scores on an exam 82 58 64 80 75 72 87 73 88 94 84 78 93 69 70 60 53 84 76 87 84 61 89 95 87 91 75 99 Step 6: Complete the Frequency Table Scores on an exam Score Frequency 95 - 99 2 90 - 94 3 85 - 89 5 80 – 84 5 75 - 79 4 70 - 74 3 65 - 69 1 60 - 64 3 55 - 59 1 50 - 54 1 RelativeCumulative Frequency 1.0000 .9285 .8214 .6428 .4642 .3213 .2142 .1785 .0714 .0357 Relative Frequency .0715 .1071 .1786 .1786 .1429 .1071 .0357 .1071 .0357 .0357 Cumulative Frequency 28 26 23 18 13 9 6 5 2 1 Just adding up the relative frequency data from the smallest to largest numbers Please note: Also just dividing cumulative frequency by total number 1/28 = .0357 2/28 = .0714 5/28 = .1786 6 bins Interval of 8 Just adding up the frequency data from the smallest to largest numbers Just dividing each frequency by total number to get a ratio (like a percent) Please note: 1 /28 = .0357 3/ 28 = .1071 4/28 = .1429
Scores on an exam 82 58 64 80 75 72 87 73 88 94 84 78 93 69 70 60 53 84 76 87 84 61 89 95 87 91 75 99 Where are we? Scores on an exam Score Frequency 95 - 99 2 90 - 94 3 85 - 89 5 80 – 84 5 75 - 79 4 70 - 74 3 65 - 69 1 60 - 64 3 55 - 59 1 50 - 54 1 Relative Frequency .0715 .1071 .1786 .1786 .1429 .1071 .0357 .1071 .0357 .0357 Cumulative Rel. Freq. 1.0000 .9285 .8214 .6428 .4642 .3213 .2142 .1785 .0714 .0357 Cumulative Frequency 28 26 23 18 13 9 6 5 2 1 Cumulative Frequency Data Cumulative Frequency Histogram
55 - 59 75 - 79 50 - 54 60 - 64 80 - 84 95 - 99 70 - 74 85 - 89 65 - 69 90 - 94 Score on exam Scores on an exam 82 58 64 80 75 72 87 73 88 94 84 78 93 69 70 60 53 84 76 87 84 61 89 95 87 91 75 99 Step 1: List scores Step 2: List scores in order Step 3: Decide grouped Step 4: Decide 10 for # bins (classes) 5 for bin width (interval size) Step 5: Generate frequency histogram Scores on an exam Score Frequency 95 - 99 2 90 - 94 3 85 - 89 5 80 – 84 5 75 - 79 4 70 - 74 3 65 - 69 1 60 - 64 3 55 - 59 1 50 - 54 1 6 5 4 3 2 1
55 - 59 75 - 79 50 - 54 60 - 64 80 - 84 95 - 99 70 - 74 85 - 89 65 - 69 90 - 94 Score on exam Scores on an exam 82 58 64 80 75 72 87 73 88 94 84 78 93 69 70 60 53 84 76 87 84 61 89 95 87 91 75 99 Generate frequency polygon Plot midpoint of histogram intervals Connect the midpoints Scores on an exam Score Frequency 95 - 99 2 90 - 94 3 85 - 89 5 80 – 84 5 75 - 79 4 70 - 74 3 65 - 69 1 60 - 64 3 55 - 59 1 50 - 54 1 6 5 4 3 2 1
55 - 59 75 - 79 50 - 54 60 - 64 80 - 84 95 - 99 70 - 74 85 - 89 65 - 69 90 - 94 Score on exam Scores on an exam 82 58 64 80 75 72 87 73 88 94 84 78 93 69 70 60 53 84 76 87 84 61 89 95 87 91 75 99 Generate frequency ogive (“oh-jive”) Frequency ogive is used for cumulative data Plot midpoint of histogram intervals Connect the midpoints Scores on an exam Score 95 – 99 90 - 94 85 - 89 80 – 84 75 - 79 70 - 74 65 - 69 60 - 64 55 - 59 50 - 54 30 Cumulative Frequency 28 26 23 18 13 9 6 5 2 1 25 20 15 10 5
Pareto Chart: Categories are displayed in descending order of frequency
Stacked Bar Chart: Bar Height is the sum of several subtotals
Simple Line Charts: Often used for time series data (continuous data)(the space between data points implies a continuous flow) Note: For multiple variables lines can be better than bar graph Note: Fewer grid lines can be more effective Note: Can use a two-scale chart with caution
Pie Charts: General idea of data that must sum to a total(these are problematic and overly used – use with much caution) Exploded 3-D pie charts look cool but a simple 2-D chart may be more clear Exploded 3-D pie charts look cool but a simple 2-D chart may be more clear Bar Charts can often be more effective
Designed our study / observation / questionnaire Collected our data Organize and present our results
Scatterplot displays relationships between two continuous variables Correlation: Measure of how two variables co-occur and also can be used for prediction Range between -1 and +1 The closer to zero the weaker the relationship and the worse the prediction Positive or negative
Correlation Range between -1 and +1 +1.00 perfect relationship = perfect predictor +0.80 strong relationship = good predictor +0.20 weak relationship = poor predictor 0 no relationship = very poor predictor -0.20 weak relationship = poor predictor -0.80 strong relationship = good predictor -1.00 perfect relationship = perfect predictor
Positive correlation: as values on one variable go up, so do values for the other variable Negative correlation: as values on one variable go up, the values for the other variable go down Height of Mothers by Height of Daughters Height ofMothers Positive Correlation Height of Daughters
Positive correlation: as values on one variable go up, so do values for the other variable Negative correlation: as values on one variable go up, the values for the other variable go down Brushing teeth by number cavities BrushingTeeth Negative Correlation NumberCavities
Perfect correlation = +1.00 or -1.00 One variable perfectly predicts the other Height in inches and height in feet Speed (mph) and time to finish race Positive correlation Negative correlation
Correlation The more closely the dots approximate a straight line,(the less spread out they are) the stronger the relationship is. Perfect correlation = +1.00 or -1.00 One variable perfectly predicts the other No variability in the scatterplot The dots approximate a straight line
Correlation does not imply causation Is it possible that they are causally related? Yes, but the correlational analysis does not answer that question What if it’s a perfect correlation – isn’t that causal? No, it feels more compelling, but is neutral about causality Number of Birthdays Number of Birthday Cakes
Positive correlation: as values on one variable go up, so do values for other variable Negative correlation: as values on one variable go up, the values for other variable go down Number of bathrooms in a city and number of crimes committed Positive correlation Positive correlation
Linear vs curvilinear relationship Linear relationship is a relationship that can be described best with a straight line Curvilinear relationship is a relationship that can be described best with a curved line
Correlation - How do numerical values change? http://neyman.stat.uiuc.edu/~stat100/cuwu/Games.html http://argyll.epsb.ca/jreed/math9/strand4/scatterPlot.htm Let’s estimate the correlation coefficient for each of the following r = +.80 r = +1.0 r = -1.0 r = -.30 r = 0.0
Variable name is listed clearly Description includes: Both variables Strength (weak,moderate,strong) Direction (positive, negative) Estimated value (actual number) Variable name is listed clearly Both axes have real numbers listed Both axes and values are labeled This shows the strong positive (r = +0.8) relationship between the heights of daughters (in inches) with heights of their mothers (in inches). 48 52 5660 64 68 72 Height of Mothers (in) 48 52 56 60 64 68 72 76 Height of Daughters (inches)
Variable name is listed clearly Description includes: Both variables Strength (weak,moderate,strong) Direction (positive, negative) Estimated value (actual number) Variable name is listed clearly Both axes have real numbers listed Both axes and values are labeled This shows the strong positive (r = +0.8) relationship between the heights of daughters (in inches) with heights of their mothers (in inches). 48 52 5660 64 68 72 Height of Mothers (in) 48 52 56 60 64 68 72 76 Height of Daughters (inches)
Variable name is listed clearly Description includes: Both variables Strength (weak,moderate,strong) Direction (positive, negative) Estimated value (actual number) Variable name is listed clearly Both axes have real numbers listed Both axes and values are labeled This shows the strong positive (r = +0.8) relationship between the heights of daughters (in inches) with heights of their mothers (in inches). 48 52 5660 64 68 72 Height of Mothers (in) 48 52 56 60 64 68 72 76 Height of Daughters (inches)
Variable name is listed clearly Description includes: Both variables Strength (weak,moderate,strong) Direction (positive, negative) Estimated value (actual number) Variable name is listed clearly Both axes have real numbers listed Both axes and values are labeled This shows the strong positive (r = +0.8) relationship between the heights of daughters (in inches) with heights of their mothers (in inches). 48 52 5660 64 68 72 Height of Mothers (in) 48 52 56 60 64 68 72 76 Height of Daughters (inches)
Variable name is listed clearly Description includes: Both variables Strength (weak,moderate,strong) Direction (positive, negative) Estimated value (actual number) Variable name is listed clearly Both axes have real numbers listed Both axes and values are labeled This shows the strong positive (r = +0.8) relationship between the heights of daughters (in inches) with heights of their mothers (in inches). 48 52 5660 64 68 72 Height of Mothers (in) 48 52 56 60 64 68 72 76 Height of Daughters (inches)
Break into groups of 2 or 3 Each person hand in own worksheet. Be sure to list your name and names of all others in your group Use examples that are different from those is lecture 1. Describe one positive correlation Draw a scatterplot (label axes) 2. Describe one negative correlation Draw a scatterplot (label axes) 3. Describe one zero correlation Draw a scatterplot (label axes) 4. Describe one perfect correlation (positive or negative) Draw a scatterplot (label axes) 5. Describe curvilinear relationship Draw a scatterplot (label axes)
Variable name is listed clearly Description includes: Both variables Strength (weak,moderate,strong) Direction (positive, negative) Estimated value (actual number) Variable name is listed clearly Both axes have real numbers listed Both axes and values are labeled This shows the strong positive (r = +0.8) relationship between the heights of daughters (in inches) with heights of their mothers (in inches). 48 52 5660 64 68 72 1. Describe one positive correlation Draw a scatterplot (label axes) Height of Mothers (in) 2. Describe one negative correlation Draw a scatterplot (label axes) 48 52 56 60 64 68 72 76 Height of Daughters (inches) 3. Describe one zero correlation Draw a scatterplot (label axes) 4. Describe one perfect correlation (positive or negative) Draw a scatterplot (label axes) 5. Describe curvilinear relationship Draw a scatterplot (label axes)
This shows the strong positive (.8) relationship between the heights of daughters (measured in inches) with heights of their mothers (measured in inches). 48 52 5660 64 68 72 Both axes and values are labeled Both axes and values are labeled Both variables are listed, as are direction and strength Height of Mothers (in) 48 52 56 60 64 68 72 76 Height of Daughters (inches)
Overview Frequency distributions The normal curve Challenge yourself as we work through characteristics of distributions to try to categorize each concept as a measure of 1) central tendency 2) dispersion or 3) shape Mean, Median, Mode, Trimmed Mean Standard deviation, Variance, Range Mean Absolute Deviation Skewed right, skewed left unimodal, bimodal, symmetric