Download
1 / 47
470 likes | 604 Vues
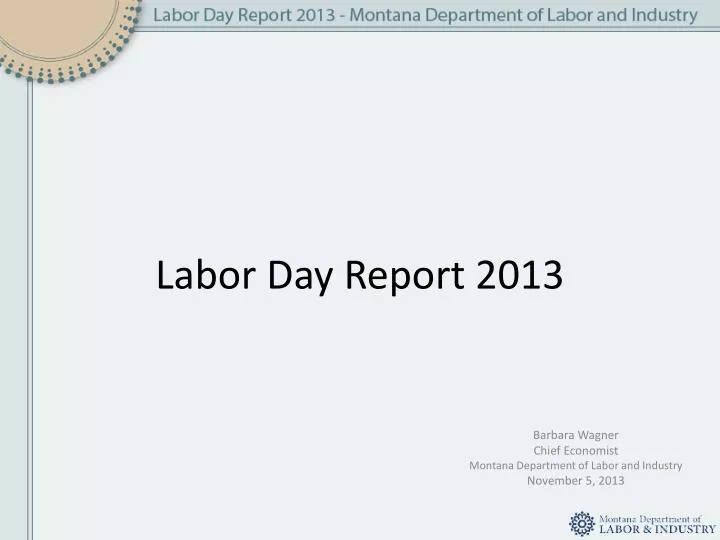
Labor Day Report 2013. Barbara Wagner Chief Economist Montana Department of Labor and Industry November 5, 2013. Montana’s Unemployment Outperformed the U.S. During the Recession. 7.2%. 5.3%. Source: Local Area Unemployment Statistics (LAUS). Unemployment Claims are Decreasing.

E N D
Labor Day Report 2013 Barbara Wagner Chief Economist Montana Department of Labor and Industry November 5, 2013
Montana’s Unemployment Outperformed the U.S. During the Recession 7.2% 5.3% Source: Local Area Unemployment Statistics (LAUS)
Unemployment Claims are Decreasing Source: LAUS, UI Claims Data, MT DLI
Where does Montana’s Unemployment Rate Come From? • Current Population Survey phone calls (~750 households) • Targets workers, includes self-employed • Includes information on part-time and discouraged workers • Current Employment Statistics (3,500 businesses) • Unemployment Insurance Claims • About third to half of unemployed receive benefits Employment and labor force distributed to each county based on Census Population and Quarterly Census of Employment and Wages.
Employment Change over Prior Year 2.3% Source: LAUS, Quarterly Census of Employment and Wages, MT DLI
Employment Change over Prior Year (2013 Estimate) Source: LAUS and QCEW, MT DLI.
Employment Change in Recession and Recovery Source: QCEW, MT DLI.
Components of GDP GOVERNMENT 20%
Debt vs. Deficit Revenues (Taxes) Outlays (Spending) Debt = Accumulated Deficit Source: Congressional Budget Office
Components of Federal Spending Source: Congressional Budget Office, 2013 Long-Term Budget Outlook
Montana Funding$5,472,629,464 in FY2013 Source: USAspending.gov
Montana Labor Force by Demographic American Indian Disabled Workers 6.7% Veterans, 10.9%
Experience: Part-Time Status Number of Weeks Worked Source: American Community Survey, 2011, 1-year Estimates
Source: American Community Survey, 2012. Map prepared by Forbes.com. Casserly, Meghan, “The Geography of the Gender Pay Gap: Women’s Earnings by State” http://www.forbes.com/sites/meghancasserly/2013/09/19/the-geography-of-the-gender-pay-gap-womens-earnings-by-state.
Source: The Simple Truth about the Gender Pay Gap. Rep. American Association of University Women, 8 Mar. 2013. 12-13. www.aauw.org/resource/the-simple-truth-about-the-gender-pay-gap.
U.S. Median Wage by Selected Occupations and Gender Women Men Source: ACS 2011, 1 year estimates
U.S. Median Wage by Gender and Industry Women Men Source: ACS 2011, 1 year estimates
U.S. Median Wage by Gender and Class of Worker Women Men Source: ACS 2011, 1 year estimates
Take Away Points • Gap exists across • Most occupations (there are some that pay is equal) • All industries • Private, public, and nonprofit • All education groups • All age groups • All states, although MT is near the bottom • Gap has decreased over time. • A good economy seems to help.
Factors Influencing Pay and the Gender Gap • Occupation choice • Industry choice • Education • Experience Montana Gap = $0.33 7₵ 14₵ 9₵
Productivity Defined High Productivity Low Productivity
Wages and Productivity Wages Labor Productivity Source: Wages from QCEW, 2011 annual. GSP and employment from the Bureau of Economic Analysis and average hours from the Current Employment Statistics. Calculated by MT DLI R&A.
Productivity and Education Source: Education attainment from 2009-2011 ACS, U.S. Census. GSP and employment from the Bureau of Economic Analysis and average hours from the Current Employment Statistics. Calculated by MT DLI R&A.
Productivity and Education • Montana’s labor productivity is lower than expected given education levels. Source: Education attainment from 2009-2011 ACS, U.S. Census. GSP and employment from the Bureau of Economic Analysis and average hours from the Current Employment Statistics. Calculated by MT DLI R&A.
Use of Technology(measured in percent of workers in IT fields) Source: Occupational Employment Statistics, 2012. Employment in 11-3021 and 15-0000 as percent of total employment.
Full report and presentation available at www.lmi.mt.gov, or directly at www.ourfactsyourfuture.org/admin/uploadedPublications/5314_LDR-13.pdf. Questions?