Download
1 / 17
220 likes | 510 Vues
Chapter 3 Measures of Central Tendency. 3.1 Defining Central Tendency. Central tendency Purpose: . Figure 3.1 Locate Each Distribution “Center”. Central Tendency Measures. Figure 3.1 shows that no single concept of central tendency is always the “best”

E N D
3.1 Defining Central Tendency • Central tendency • Purpose:
Central Tendency Measures • Figure 3.1 shows that no single concept of central tendency is always the “best” • Different distribution shapes require different conceptualizations of “center” • Choose the one which best represents the scores in a specific situation
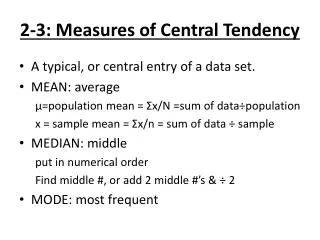
3.2 The Mean • The mean is the sum of all the scores divided by the number of scores in the data. • Population: • Sample:
Learning Check A sample of n = 12 scores has a mean of M = 8. What is the value of ΣX for this sample?
Characteristics of the Mean • Changing the value of a score changes the mean • Introducing a new score or removing a score changes the mean (unless the score added or removed is exactly equal to the mean) • Adding or subtracting a constant from each score changes the mean by the same constant • Multiplying or dividing each score by a constant multiplies or divides the mean by that constant
Learning Check A sample of n = 7 scores has M = 5. All of the scores are doubled. What is the new mean?
3.3 The Median • The median is the midpoint of the scores in a distribution when they are listed in order from smallest to largest • The median divides the scores into two groups of equal size
Example 3.5Locating the Median (odd n) • Put scores in order • Identify the “middle” score to find median 3 5 8 10 11
Example 3.6Locating the Median (even n) • Put scores in order • Average middle pair to find median 1 1 4 5 7 9
Learning Check • Decide if each of the following statements is True or False.
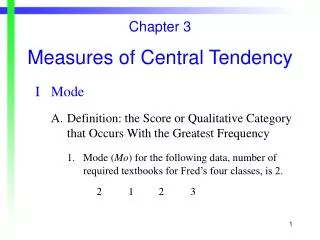
3.4 The Mode • The mode is the score or category that has the greatest frequency of any score in the frequency distribution
3.6 Central Tendency and the Shape of the Distribution • Symmetrical distributions
Learning Check • A distribution of scores shows Mean = 31 and Median = 43. This distribution is probably