Download
1 / 12
480 likes | 1.65k Vues
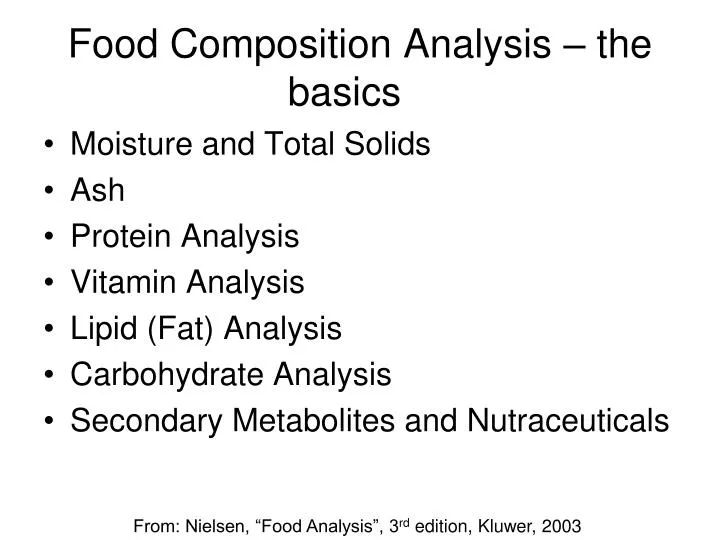
Food Composition Analysis – the basics . Moisture and Total Solids Ash Protein Analysis Vitamin Analysis Lipid (Fat) Analysis Carbohydrate Analysis Secondary Metabolites and Nutraceuticals. From: Nielsen, “Food Analysis”, 3 rd edition, Kluwer, 2003. AOAC International.

E N D
Food Composition Analysis – the basics • Moisture and Total Solids • Ash • Protein Analysis • Vitamin Analysis • Lipid (Fat) Analysis • Carbohydrate Analysis • Secondary Metabolites and Nutraceuticals From: Nielsen, “Food Analysis”, 3rd edition, Kluwer, 2003
AOAC International • Established in 1884 by USDA as the Association of Official Agricultural Chemists • Now the Association of Official Analytical Chemists (reflects membership) • Includes microbiologists and food scientists • Most of the accepted methods to analyze foods have been developed and/or validated by AOAC • Three methods validation programs, the AOAC® Official Methods Program® Peer-VerifiedMethods Program, and the AOAC® Performance Tested Methods Program
Moisture content and total solids • Necessary to know when computing nutritional value • May affect stability of dehydrated foods • Moisture content may be specified in compositional standards • (i.e. cheddar cheese must be < 39% moisture) • 3 forms of water in food products • free water • adsorbed – held tightly in cell walls or to proteins • hydrates – some proteins or salts exist as hydrates • Best method depends on primary form and may be specified by AOAC guidelines
Methods to determine water content/total solids • Sample handling must be controlled to avoid inadvertent moisture loss • Oven drying – sample heated under specified conditions, weight determined by difference • convection, forced draft or vacuum ovens • sample may be steam-dried or air dried prior to oven drying • particle size & surface area affects rate of loss • high temp. (250oC) dries more completely, lessens time required, but may cause decomposition, loss of volatiles • carbohydrate decomposition also possible • Vacuum ovens allow drying at a lower temp, shorter time • Freeze-drying can prevent thermal decomposition • requires sample be pre-frozen
Methods to determine water content – non-oven • Microwave analysis • Infrared drying • Distillation • sample is co-distilled with high bp solvent • Karl Fischer titration • more accurate for low-moisture foods • 2H2O + SO2 + I2 C5H2SO4 + 2HI • pyridine & methanol used to dissolve reagents • Unreacted iodine is measured visually or by potentiometry • Electrical methods • Refractometry • Water activity – measure of vaporization
Ash • Inorganic matter remaining after oxidation or ignition of a sample • Ash content = total mineral content • Dry ashing converts most minerals (Fe, Se, Pb, etc.) to oxides, sulfates, phosphates, chlorides & silicates • Wet ashing used for minerals where volatilization is an issue • Uses mixtures of HNO3, H2SO4/H2O2 and HClO4 to oxidize materials completely • Fresh foods usually low in ash; high-ash foods linked to digestive issues
Basic protein analysisNielsen, Ch. 9 • Food proteins are varied in structure and size (5 kDa – 1000 kDa or more) • N is the distinguishing element and N content ranges from 13 – 19% in proteins • accurate analyses important particularly for enzymes • other N-containing molecules (free aa’s, small peptides, nucleic acids, alkaloids, amino sugars, some vitamins) interfere • proteins easily denatured by heat, acid, base, organics & detergents • most analyses based on determination of N, peptide bonds, aromatic aa’s, uv-absorption, light-scattering and binding dye molecules
Peptide backbone • R groups (aa side chains) may be hydrophilic (polar), • hydrophobic (nonpolar), aromatic, acidic or basic • Some analyses (e.g. Kjeldahl method) require hydrolysis of • peptide linkages to liberate free amino acids (digestion) • Some require that peptide linkages remain intact so that • peptide functional group can be detected (IR), metal chelation • Some require intact protein structure which can interact with • a dye, producing a detectable endpoint
Kjeldahl method (AOAC) • Sample is digested with H2SO4 and a metallic catalyst (Hg, SeO2, or Cu) • KMnO4 added to fully oxidize N to NH4SO4 • Base is added to release free NH3, which is then distilled into boric acid solution • (NH4)2SO4 + 2 NaOH 2 NH3 + Na2SO4 + 2 H2O • NH3 + H3BO3 NH4+ + H2BO3- • H2BO3- + H+ H3BO3 • Borate is titrated with std. HCl • Moles HCl = moles NH3 = moles N in original sample • avg. protein = 16% N, so %N x 6.25 = % protein • Disadvantage: measures all N sources, slow
Dumas method (AOAC) • Combustion of samples releases N2 gas • N2 quantified by GC with TCD detection • Infrared spectroscopy methods (AOAC) • Protein can be quantified using absorption bands in the IR (2.5 – 15 um or 4000-600 cm-1) • Amides have several bands in 1560-1695 cm-1 range • (C=O stretch, N-H bending) • Near IR (700-2500 nm) instruments also used to detect N-H deformation abs @ 2080-2220 nm (more on IR: Ch. 24) • J. Agric. Food Chem. 2010, 58, 702–706 – NIR with PLS regression analysis to predict protein content of bean seeds
Biuret and Lowry methods • Under basic conditions, peptide bonds complex Cu2+ purple color • Biuret reagent: CuSO4, NaOH, potassium sodium tartrate (stabilizes Cu2+) • Reagent mixed with sample at RT, abs @ 540 nm measured, std against BSA • Lowry method uses Biuret reagent plus Folin-Ciocalteu reagent (phosphomolybdic/phosphotungstic acids) which reacts with tyrosine & tryptophan blue-green color • Samples measured @ 650 nm • Advantage: greater sensitivity and specificity • Disadvantage: interference by sugars, lipids, phosphate buffer, polyphenols
Bradford assay • Uses Coomassie Brilliant Blue G-250 dye • When protein solution is acidified below pI, electrostatic interaction w/dye • Changes red blue upon binding protein • lmax 465 nm 595 nm • Abs read @ 595 nm • Protein concentration determined by comparison to std curve for BSA Advantages: even more sensitive than Lowry and no interference from sugars or polyphenols