Download
1 / 14
140 likes | 209 Vues
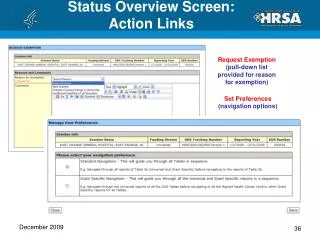
Overview of links between TADA-Ed frames. Agathe Merceron Kalina Yacef. Point Selection. We can select a bar. Corresponding points are highlighted in PointsView…. ..and the name of the attribute selected is displayed. View only points selected in GraphView. K-Means.

E N D
Overview of links between TADA-Ed frames Agathe Merceron Kalina Yacef
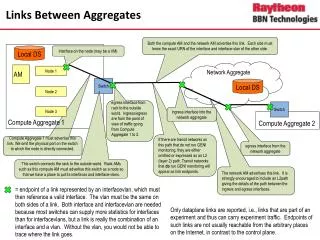
We can select a bar Corresponding points are highlighted in PointsView… ..and the name of the attribute selected is displayed
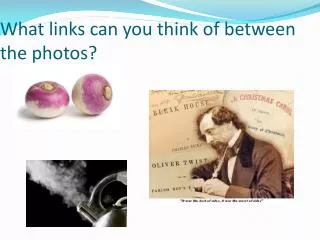
Points are colored according to their clusters, here displayed per question id and per login
Points in same clusters are grouped, for better visualisation
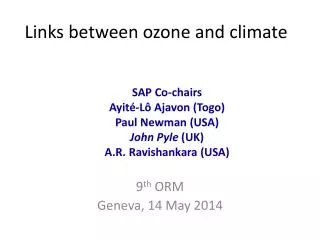
The color highlights the characteristics shared by the clusters:Red means that most elements in the cluster had this attribute.(eg ALL students in cluster 3 made a mistake with the concept Conditional Proof)Blue means that most elements did NOT have this attribute.(eg 24% of students in cluster 2 made a mistake with the same concept)
Students in cluster 2 made mistakes on average with 2.68 exercises, whereas those in cluster 4 made mistakes with 4.33 exercises Students in cluster 2 made on average 10.29 mistakes across all exercises, whereas those in cluster 4 made on average 70.5 mistakes