Download
1 / 19
190 likes | 389 Vues
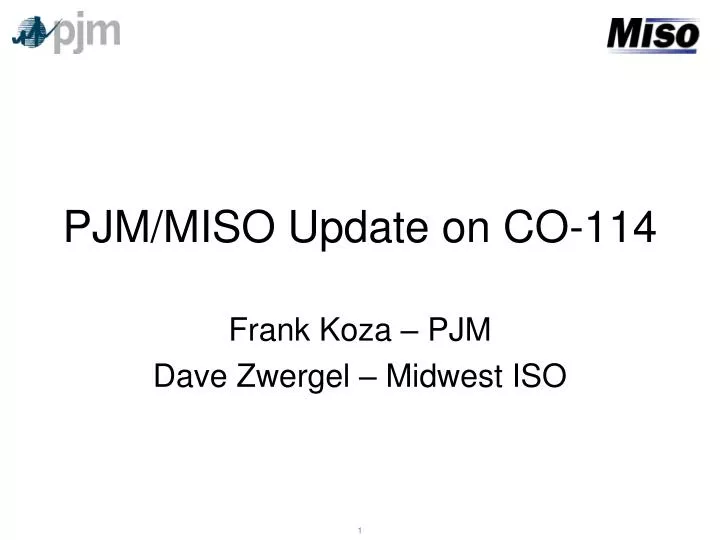
PJM/MISO Update on CO-114. Frank Koza – PJM Dave Zwergel – Midwest ISO. CO 114 Behavior. TLR results on PJM Coordinated Flowgates have been questionable since AEP and DPL joined PJM

E N D
PJM/MISO Update on CO-114 Frank Koza – PJM Dave Zwergel – Midwest ISO 1
CO 114 Behavior • TLR results on PJM Coordinated Flowgates have been questionable since AEP and DPL joined PJM • Calculations produce “unrealistically excessive flow” across all priorities (7-Firm, 6-Non-Firm Network, and 2-Hourly) • PJM flows have often increased tenfold • Results add uncertainty to operations • How much is relief should I ask for? • How much is relief will I get? 2
Examples PJM Impact Based on Distribution Factors calculated with PSS/e MUST and Generator Output from Jan 5, 2005 101 Kammer #8 xfmr l/o Kammer-South Canton 765 kV line Flowgate Limit is 3695 3
Examples PJM Impact Based on Distribution Factors calculated with PSS/e MUST and Generator Output from Jan 5, 2005 1719 Mt. Storm-Doubs 500/Mt. Storm-Meadow Brook 500 Flowgate Limit is 2598 4
Examples PJM Impact Based on Distribution Factors calculated with PSS/e MUST and Generator Output from Jan 5, 2005 2337 Cook-Palisades345/BentnHrbr-Palisades345 Flowgate Limit is 2094 5
Results and Consequences RCs may have to request much more relief than is actually necessary to effect curtailments RCs may believe flows represent available relief, when in fact, the flows are reported erroneously and no relief is available Operator Flow Change Request: -1500 MW 6
Analysis • Since the RTO is responsible for calculating Market Flow, PJM and MISO jointly investigated the discrepancies to find the cause • Assumptions hid an inequality in the basic calculation mechanism • Testing was done with generators at the same output levels, but shifts in output levels would have demonstrated the inequality • Load Shift Factor aggregations must be consistent between pre- and post-expansion models • Since CE joined PJM as a separate Control Area, problem remained hidden until AEP and DPL joined and the LSFs were merged 7
Historic Footprint Gen 1 1100 MW Output GSF = 0.10 Gen 2 900 MW Output GSF = -0.20 Load 2 1000 MW Demand LSF = -0.30 Load 1 1000 MW Demand LSF = -0.20 Control Area 1 Control Area 2 Flowgate X PTP Tag would be 100MW * (.10 – (-.20)) = 30MW 8
Merged Gen 1 1100 MW Output GSF = 0.10 Gen 2 900 MW Output GSF = -0.20 Load 2 1000 MW Demand LSF = -0.30 Load 1 1000 MW Demand LSF = -0.20 Control Zone 1 New Control Area Control Zone 2 Flowgate X No Point to Point Tag (becomes internalized) 9
Comparison Plus Point to Point Impact 10
Solution • Considered multiple solutions • Threshold change • Netting • Partial netting • Best Solution Found • RTOs use load shift factors similar to those used in the firm usage calculation • Control Zone impacts will be determined as if Historic CAs remain in place (GLDF = GSF – Historic LSF) • Inter-Zone Transfer Impacts will be determined as if Historic CAs remain in place (Xfer TDF = Historic TDF – Historic TDF) • Generation in a Zone in excess of Zone Load will be considered transfer MW (but sum of all Zonal Gen + Transfer Gen will not exceed RTO Load) • Market flow values will regain accuracy consistent with firm usage 11
Solution Step 1 Gen 1 1100 MW Output GSF = 0.10 Gen 2 900 MW Output GSF = -0.20 Load 2 1000 MW Demand LSF = -0.30 Load 1 1000 MW Demand LSF = -0.20 Control Area 1 New Control Area Control Area 2 Flowgate X Calculate GTL Impacts as if Historic Footprint still existed 12
Solution Step 2 Gen 1 1100 MW Output GSF = 0.10 Gen 2 900 MW Output GSF = -0.20 Load 2 1000 MW Demand LSF = -0.30 Load 1 1000 MW Demand LSF = -0.20 Control Area 1 New Control Area Control Area 2 Flowgate X Calculate PTP Impacts of Transferring Excess MW 13
Comparison Plus Point to Point Impact 14
New vs. Old Process PJM Impact Based on Distribution Factors calculated with PSS/e MUST and Generator Output from Jan 5, 2005 101 Kammer #8 xfmr l/o Kammer-South Canton 765 kV line Moderate Increase in Flows 15
New vs. Old Process PJM Impact Based on Distribution Factors calculated with PSS/e MUST and Generator Output from Jan 5, 2005 1719 Mt. Storm-Doubs 500/Mt. Storm-Meadow Brook 500 Mild Increase in Flows Some Firm became Non-Firm 16
New vs. Old Process PJM Impact Based on Distribution Factors calculated with PSS/e MUST and Generator Output from Jan 5, 2005 2337 Cook-Palisades345/BentnHrbr-Palisades345 Moderate Increase in Flows 17
Questions? 18