Download
1 / 6
60 likes | 189 Vues
Results (Line 7) Bright Reflector found at about 75m Dipping to the SSW No topographic correlation. Processing Plus Minus Method Minus time, T - = t AG - t BG Plus time, T + = t AG + t BG - t AB Depth,. Amplitude Recovery. CDP sort. Geometry. Brute Stack. Elevation statics.

E N D
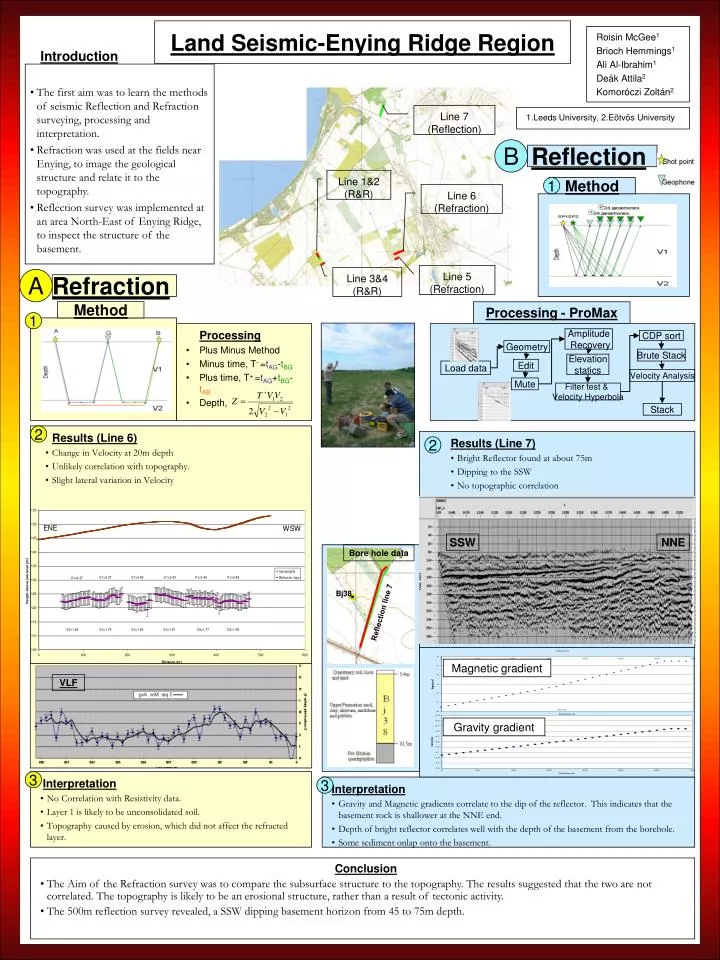
Results (Line 7) Bright Reflector found at about 75m Dipping to the SSW No topographic correlation Processing Plus Minus Method Minus time, T- =tAG-tBG Plus time, T+ =tAG+tBG-tAB Depth, Amplitude Recovery CDP sort Geometry Brute Stack Elevation statics Line 7 (Reflection) Edit Load data Velocity Analysis Line 1&2 (R&R) Mute Line 6 (Refraction) Filter test & Velocity Hyperbola Stack Line 5 (Refraction) Line 3&4 (R&R) Roisin McGee1 Brioch Hemmings1 Ali Al-Ibrahim1 Deák Attila2 Komoróczi Zoltán2 Land Seismic-Enying Ridge Region Introduction • The first aim was to learn the methods of seismic Reflection and Refraction surveying, processing and interpretation. • Refraction was used at the fields near Enying, to image the geological structure and relate it to the topography. • Reflection survey was implemented at an area North-East of Enying Ridge, to inspect the structure of the basement. 1.Leeds University, 2.Eötvös University B Reflection 1 Method A Refraction Method Processing - ProMax 1 2 Results (Line 6) • Change in Velocity at 20m depth • Unlikely correlation with topography. • Slight lateral variation in Velocity 2 SSW NNE Bore hole data Bj38 Reflection line 7 Magnetic gradient VLF Gravity gradient 3 Interpretation • No Correlation with Resistivity data. • Layer 1 is likely to be unconsolidated soil. • Topography caused by erosion, which did not affect the refracted layer. 3 Interpretation • Gravity and Magnetic gradients correlate to the dip of the reflector. This indicates that the basement rock is shallower at the NNE end. • Depth of bright reflector correlates well with the depth of the basement from the borehole. • Some sediment onlap onto the basement. Conclusion • The Aim of the Refraction survey was to compare the subsurface structure to the topography. The results suggested that the two are not correlated.The topography is likely to be an erosional structure, rather than a result of tectonic activity. • The 500m reflection survey revealed, a SSW dipping basement horizon from 45 to 75m depth.
The Aim of the Refraction survey was to compare the subsurface structure to the topography, and it was proven that the two are not correlated. The Basement was imaged, using a reflection survey, and the shallow geological structure was revealed. Basement is at ….depth
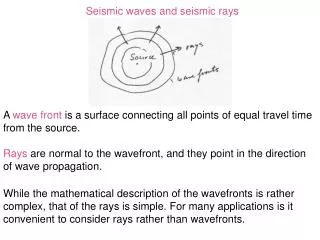
A G B Shot point Geophone V1 Depth V2 2 24 geophones 1 24 geophones SP1 SP2 V1 Depth V2
Load data Geometry Edit Mute Amplitude Recovery Elevation statics Filter test & Velocity Hyperbola CDP sort Brute Stack Velocity Analysis Stack
Amplitude Recovery CDP sort Geometry Brute Stack Elevation statics Edit Load data Velocity Analysis Mute Filter test & Velocity Hyperbola Stack