Download
1 / 43
430 likes | 503 Vues
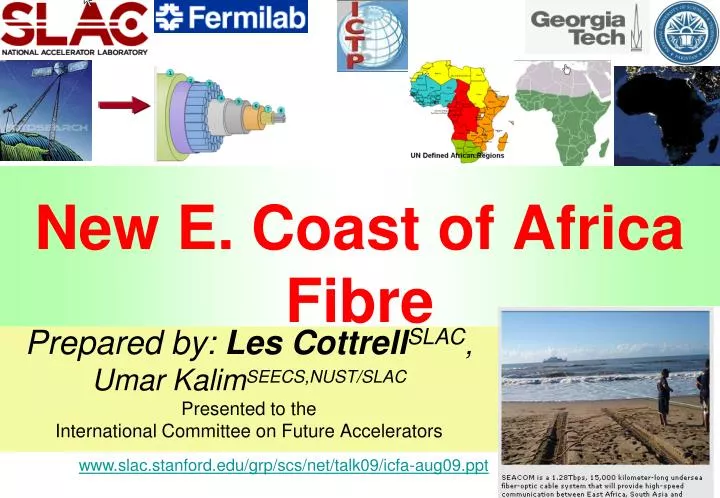
New E. Coast of Africa Fibre. Prepared by: Les Cottrell SLAC , Umar Kalim SEECS,NUST/SLAC Presented to the International Committee on Future Accelerators. www.slac.stanford.edu/grp/scs/net/talk09/icfa-aug09.ppt. Summary. Current State What is happening? Impact Next Steps.

E N D
New E. Coast of Africa Fibre Prepared by: LesCottrellSLAC, Umar KalimSEECS,NUST/SLAC Presented to the International Committee on Future Accelerators www.slac.stanford.edu/grp/scs/net/talk09/icfa-aug09.ppt
Summary • Current State • What is happening? • Impact • Next Steps
World Throughput Trends Derived throughput ~ 8 * 1460 /(RTT * sqrt(loss)) Mathis et. al Behind Europe 5 Yrs: Russia, Latin America, Mid East 6 Yrs: SE Asia 9 Yrs: South Asia 12 Yrs: Cent. Asia 16 Yrs: Africa Central Asia, and Africa are in Danger of Falling Even Farther behind In 10 years at the current rate Africa will be 1000 times worse than Europe 1993
Current State: E. Africa worst in Africa • Not only is Africa in a sorry state Internet wise • But also within Africa E. and Central Africa are the worst off
Current State: RTT & GEOS • RTTs > 400 ms are probably via GEOStationary Satellite connections • Central & E. Africa only have had GEOS connections • Satellite connections are low bandwidth and costly in $/Mbps for sub-Sahara • E.g broadband costs 50 times that in US • >800% of monthly salary c.f. 20% in US
PingER • Coverage extended to better understand Africa • 50 countries, > 160 sites • Funding from Pakistan & pro-bono
What is happening • Up until July 2009 only one (no competition) submarine fibre optic cable to sub-Saharan Africa (SAT3) costly (no competition) & only W. Coast • 2010 Football World Cup => scramble to provide fibre optic connections to S. Africa, both E & W Coast • Multiple providers = competition • E. Coast: Seacom & TEAMs landed Jul 2009, Seacom working
Impact: RTT etc. • As sites move their routing from GEOS to terestrial connections, we can expect: • Dramatically reduced Round Trip Time (RTT), e.g. from 700ms to 350ms – seen immediately • Reduced losses and jitter due to higher bandwidth capacity and reduced contention – when routes etc. stabilized Aug 1 ’09 23:00hr • Effects have been seen in leading Kenyan & Tanzanian hosts SLAC to Kenya site Avg RTT Loss 720ms 325ms
Next Steps: Going inland • Extend coverage from landing points to capitals and major cites • Need fibre connections inland Northern Central Southern
Next Steps: Beyond Fibre’s reach • In areas where fibre connections are not available (e.g. rural areas), the main contenders appear to be: • wireless, e.g. microwave, cellphone towers, WiMax etc., • Low Earth Orbiting Satellites (LEOS) for example Google signed up with Liberty Global and HSBC in a bid to launch 16 LEOS satellites, to bring high-speed internet access to Africa by end 2010, • and weather balloons, also see here for some dicsussion of the attractivenss of this technology.
Next Steps: Let’s get together • Get leaders such as universities, academic establishments (teach the teachers) to get togeher to form NRENs for country • Bargain for cheaper rates • BW most expensive worldwide ($4K/Mbps) • Then NRENS get together to create International eXchange Points (IXPs) • Avoid intercountry links using expensive intercontinental links via Europe and the US.
Routing • Used to typically go through a satellite provider such as Newskies • Now TZ & KE go via London and Teleglobe & terrestrial fibre S. Africa • IXPs starting up, e.g. • S. Africa direct to Namibia, Botswana, Mozambique • Burkina Faso direct to Mali, Senegal, Benin • Ubuntunet Alliance • Founders: Kenya, Malawi, Mozambique, Rwanda South Africa • Joined by DRC, SD, TZ, UG Burkina Faso
Impact for Science • African scientists isolated • Lack critical mass, need network to collaborate • Brain drain • Brain gain, tap diaspora • Massification – blend distance learning • Provide leadership, train trainers
More Information • Case Study: • https://confluence.slac.stanford.edu/display/IEPM/New+E.+Coast+of+Africa+Fibre • Ubuntunet Alliance • http://www.ubuntunet.net/ • Weather balloons • http://www.internetevolution.com/author.asp?section_id=694&doc_id=178131& • http://crossedcrocodiles.wordpress.com/2009/06/26/undersea-broadband-fiber-optic-cables-to-africa/ • Google LEOS’ • http://gigaom.com/2008/09/09/google-invests-in-satellite-based-internet-startup/
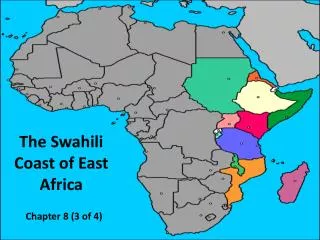
Africa is Huge • India 10% area, but > population, hard to get fibre everywhere
…and diverse (e.g. languages) • More than 1,000 indigenous African languagesincluding several spoken by tens of millions such as Igbo, Swahili, Hausa, Amharic, and Yoruba; • Plus Arabic, English, French, Portuguese, Afrikaans, Spanish, Indian languages, others
African World Status Fibres Light at night • Internet city connections Capacity From Telegeography
World ViewsCartogram perspective see www.geog.qmw.ac.uk/gbhgis/conference/cartogram.html Population Area Tertiary Education from http://www.worldmapper.org/ Internet Users 2002
Possible Attractions Emerging Niche Mature Emerging Longterm Emerging Strategic • Large Population (~1 Billion) • Youthful population • Saturation of developed markets makes emerging markets interesting to business (Vital Wave) • Leapfrog technologies (cell phones, wireless …)
PingER Deployment • PingER project originally (1995) for measuring network performance for US, Europe and Japanese HEP community - now mainly R&E sites • Extended this century to measure Digital Divide: • Collaboration with ICTP Science Dissemination Unit http://sdu.ictp.it • ICFA/SCIC: http://icfa-scic.web.cern.ch/ICFA-SCIC/ • >165 countries (98% world’s population, >99% world’s connected population) • Monitors (>40 in 23 countries – 3 Africa) • Beacons ~ 90 (all monitors monitor beacons) • Remote sites (>700)
PingER Growth in Time IHY/eGY NUST ICTP & NATO ICFA
World Measurements: Min RTT from US • Maps show increased coverage • Min RTT indicates best possible, i.e. no queuing • >400ms probably geo-stationary satellite • Between developed regions min-RTT dominated by distance - Little improvement possible • Only a few places still using satellite for international access, mainly Africa & Central Asia 2000 2008
Loss With TCP (>80% Internet traffic) recovery from loss can take several seconds, such delays make interactive use annoying to impossible. For non TCP multi-media traffic loss causes poor voice/video (VoIP/H323) above 1.5%,loss > 0.5% unacceptable for IPTV http://www.slac.stanford.edu/comp/net/wan-mon/tutorial.html#loss • Africa by far worst region, • 10-20 times worse than developed regions
Similar Results from Europe (CERN)(so for rest use SLAC Results since more coverage) • EU, US/CA, Oceania, E. Asia lead • SE Europe, Russia catching up • S. Asia. Mid East, C. Asia poor • Africa poor and falling behind
Some Other World Views Data Transfer Capacity Voice & video (de-jitter) Network & Host Fragility
ITCP Internet Weather for Africa • www-iepm.slac.stanford.edu/pinger/africa-weather08.mov
Demo • Shows population=bubble area, y=throughput, x=RTT as a function of time • Note • Improved performance & increase of coverage with time • Africa clusters towards long RTT and poor throughput (bottom left) and generally far worse than rest of world • African varies by countries (cf Egypt & Ethiopia) • Big variations year to year • Correlate with DOI index (opportunity, infrastructure, usage) • by mobile telephony, Internet tariffs, #computers, fixed line phones, mobile subscribers, Internet users)/population • http://www-iepm.slac.stanford.edu/pinger/pinger-metrics-motion-chart.html
Mediterranean. & Africa vs HDI HDI related to GDP, life expectancy, tertiary education etc. • There is a good correlation between the 2 measures • N. Africa has 10 times poorer performance than Europe • N. Africa several times better than say E. Africa • E. Africa poor, limited by satellite access • W. Africa big differences, some (Senegal) can afford SAT3 fibre others use satellite • Great diversity between & within regions
African Situation 1 yr of Internet access > average annual income of most Africans, Survey by Paul Budde Communications • Access to the internet is so desirable to students in Africa that they spend considerable time and money to get it. Many students surveyed, with no internet connection at their universities, resorted to private, fee-charging internet cafes to study and learn. www.arp.harvard.edu/AfricaHigherEducation/Online.html • Survey (IHY meeting Ethiopia in November ’07) of leading Universities in 17 countries (will repeat with more clarity): • Each had tens of 1000’s of students, 1000 or so staff • Best had 2 Mbits, worst dial up 56kbps • Often access restricted to faculty Internet Café in Ghana • School in a secondary town in an East Coast country with networked computer lab spends 2/3rds of its annual budget to pay for the dial-up connection. • Disconnects Heloise Emdon, Acacia Southern Africa
Sub-Saharan broadband cost off-scale Source ITU • www.itu.int/ITU-D/ict/publications/idi/2009/index.html
Opportunities: Routing • Seen from TENET Cape Town ZA • Only Botswana & Zimbabwe are direct • Most go via Europe or USA • Wastes costly international bandwidth • Need IXPs in Africa
IXPs a Major Issue for African Internet Internet B A • International bandwidth prices are biggest contributor to high costs • African users effectively subsidise international transit providers! • Fibre optic links are few and expensive reliance on satellite connectivity • High satellite latency slow speed, high prices • Growth of Internet businesses is inhibited • In 2003 10 out of 53 countries had IXPs, now 16 • More IXPs lower latency, lower costs, more usage • Both national and regional IXPs needed • Also needed: regional carriers, more fibre optic infrastructure investment • Need NRENs country ->region • Then international IXPs IXP • Américo Muchanga americo@uem.mz, • 25 September 2005
Opportunities: Fibre, satellite, mobiles • Satellite is extremely effective in reaching places where the volume of traffic would not justify a fibre connection. • GEOS satellite $/Mbps 300-1000 x Fibre, severely bandwidth-constrained and high latency • So fibre international and to major cities • Scramble to provide international fibre for World Cup 2010 • then wireless (cell phone, wimax, LEOS…) • cell phone growth leads Internet growth by 4.5 years • 16 LEOS (reduce latency) - Sep 2008 • Google signed up with Liberty Global and HSBC in a bid to launch 16 LEOS satellites, to bring high-speed internet access to Africa by end 2010 • ABUJA Africa's first communications satellite has suffered an energy failure just 18 months after its launch - Nov. 2008 34
African International Fibres 2010 Current: SAT-3-WASC run by a consortium of state monopolies that has opted for elite rather than mass market. Prices tend to align to satellite in the absence of competition! “Black” Fibres installed along roads, pylons etc. remain unused because of monopoly regulation!
Africa Many systemic factors:Electricity, import duties,skills, disease, protectionist policies, conflict, corruption. ~ 3x lower penetration than any other region huge potential market Huge growth http://www.internetworldstats.com/
PingER: African coverage • Host monitored in 50 of 60 countries (98.7% pop) • ~130 hosts monitored in Africa • Cannot find hosts in Chad, Comoros, Eq. Guinea, Sao Tome, Somalia • Yellow only 1 host (so could be anomalous, e.g. Libya) • Need help for contacts: (cottrell@slac.stanford.edu) Hosts monitored/beacons Only 1 host
Conclusions: The bad • Poor performance affects data transfer, multi-media, VoIP, IT development & country performance / development • DD exists between regions & countries, rural vs cities, poor vs rich, old vs young… • Decreasing use of satellites, expensive, but still needed for many remote countries in Africa and C. Asia • Last mile problems, and network fragility • Current providers (cable and satellite) have a lot to loose • Many of these have close links to regulators and governments (e.g. over 50% of ISPs in Africa are government controlled) • Africa worst by all measures(throughput, loss, jitter, DOI, international bandwidth, users, costs …)and falling further behind.
Conclusions: There is Hope “The way we develop here in Africa will be different from the way the big nations developed. They grew up with computers. We are growing up with mobile phones.- Fritz Ekwoge” • World cup: international fibre access + competition • LEOS • Leapfrog last mile fixed wire with wireless • Cheaper end points: OLTP, net computer, smart-phones • Banding together of universities => leverage influence & get deals => NRENs => IXPsUsers • E.g. Ubuntunet, Bandwidth Initiative • Standards: • Harmonization of regulations country to country • Cheaper cell phone, can’t afford multiple technologies & frequencies • Regulatory regimes becoming: • more open/transparent, less resistant to change
Conclusions: PingER • Measures Internet performance • non subjective, • relatively easy/quick to measure (c.f. ITU etc methods) • So monthly, daily updates • correlates strongly with economic/technical/development indices • Increase coverage of monitoring to understand Internet performance • Gives baselines, trends, effect of improvements • Relative comparisons countries, regions, sites • Lot of granularity: • within countries, monthly, daily • Reasonable coverage for Africa (48 of 53 countries)
IHY Sites & PingER Google maps • Zoom, pan etc. • IHY coordinates from Monique Petitdidier (CNRS) • SIDs from Deborah Scherrer (Stanford) • To come: Barbara Thompson (NASA) www.slac.stanford.edu/comp/net/wan-mon/viper/ihy_googlemap.htm
PingER monitoring of events • Effect of Mediterranean fibre cuts Dec 2008 • confluence.slac.stanford.edu/display/IEPM/Effects+of+Mediterranean+Fibre+Cuts+December+2008 Kbits/s 0:00am 22 Dec 8:30am 19 Dec RTT SLAC to Oman Contour map of performance Dec 2008 for hosts In countries affected by fibre cut Seconds
More Information • Thanks: • Incentive: ICFA/SCIC, Monique Petitdidier, ICTP, ITU • Funding: DoE/SLAC/HEP, Pakistan HEC • Effort: SLAC, ICTP (Trieste), FNAL, Georgia Tech, administrators at over 40 monitoring sites • ITU/WIS Report 2006 & 2007 (or Google: “WSIS Report 2007”) • www.itu.int/osg/spu/publications/worldinformationsociety/2007/report.html • www.itu.int/ITU-D/ict/publications/idi/2009/index.html • Higher Education in Sub-Saharan Africa • www.arp.harvard.edu/AfricaHigherEducation/Online.html • PingER • www-iepm.slac.stanford.edu/pinger, sdu.ictp.it/pinger/africa.html • www.slac.stanford.edu/xorg/icfa/icfa-net-paper-jan09/ • Global Information watch: www.giswatch.org • Need network contacts in Africa: cottrell@slac.stanford.edu