Download
1 / 23
230 likes | 380 Vues
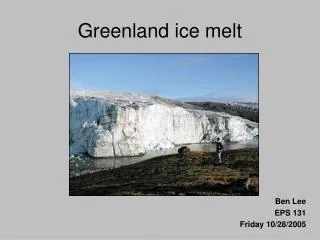
The melting ice in Greenland from local to regional scale. Copenhagen, November 24. Sebastian H. Mernild Climate, Ocean, and Sea Ice Modeling Group (COSIM) Los Alamos National Laboratory, New Mexico, USA Email: mernild@lanl.gov. D. Rumsfeld, former U.S. Secretary of Defense.

E N D
The melting ice in Greenland • from local to regional scale Copenhagen, November 24 Sebastian H. Mernild Climate, Ocean, and Sea Ice Modeling Group (COSIM) Los Alamos National Laboratory, New Mexico, USA Email: mernild@lanl.gov
D. Rumsfeld, former U.S. Secretary of Defense “There are things we know. There are things we know we don’t know. There are things we don’t know we don’t know.”
Source: Roberts et al. 2010. Source: Roberts et al. 2010.
Outline - Arctic temperatures change, - Local glacier observations (1995-2010), - Greenland Ice Sheet (GrIS) surface melt extent (1960-2080), - GrIS surface mass balance (1950-2080), - GrIS tipping point, - GrIS mass budget and area loss. Source: Roberts et al. 2010.
1880-present: ~0.7 to 0.8 degree C 1960-present: ~0.6 degree C 2000-present: ~<0.1 degree C Same trend for: Hadley, GISS, and CCSM. Every year this century has been among the top 10 warmest years since instrumental records began, despite solar radiation being relatively weak over the past yearsSource: Allison et al. 2009. Source: NOAA/NCDC
Annual temperature anomaly vs. latitude: 1880-2007 Annual temperature anomaly vs. latitude: 1880-2007 Jan Apr Jul Oct Annual temperature: 1957-2009 Winter temperature: 1957-2009 Source: National Aeronautics and Space Administration (NASA).
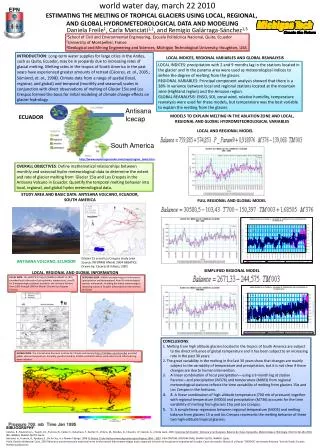
Local glaciers and ice caps mass loss: Source: Koç et al. 2009. Glaciers around the globe have been shrinking since the end of the Little Ice Age (1900), with increasing rates of ice loss since the early 1980s. The ongoing trend of worldwide and rapid glacier shrinkage may lead to the complete deglaciation of large parts of many mountain regions by the end of the 21st century. The figure does not include contributions from: Greenland Ice Sheet, local glaciers in Greenland, and Antarctica.
Local glaciers and ice caps mass loss: Source: M. Nolan, University of Alaska Fairbanks (UAF). 1925 2006 Source: UAF. Source: S. Mernild, LANL.
Local glacier mass loss: 1931 Local glacier mass loss: 2006 Source: Mernild et al. review Nature Geoscience The only local glacier in Greenland where long-term observations of both surface mass balance and glacier front fluctuations are available: since 1931, the glacier terminus has retreated by about 1300 m. Average retreat ~16 m yr-1; in 2009/10 ~30 m 2009/10 average terminus melt rate 4.5 to 5.2 m, twice the average value of approximately 2.5 m. Source: B. Hasholt, University of Copenhagen.
Local glacier mass loss: In 13 of the last 15 years, the MG had a negative surface mass balance, Greatest annual mass loss in 2009/10 of 2.16 m w.eq. Since 1995 the MG is significantly out of equilibrium and will likely lose approximately 60% of its area and 70% of its volume, even in the absence of further climate change. Bahr et al. (2009): Global average, glaciers and ice caps must lose at least 27% of their volume (the equivalent of an 18-cm rise in global average sea level) to return to equilibrium. (αr=AAR/AAR0, where ps=αr–1 and pv=αrg–1, where ps is the fractional area change, pv is the fractional volume change, and g=1.36 is an empirical constant) Source: Mernild et al. review Nature Geoscience. MG is representative of many hundreds of local glaciers found in East Greenland outside the Greenland Ice Sheet, and these observations quantitatively document the general retreat of local glaciers in Southeast Greenland under ongoing climate warming.
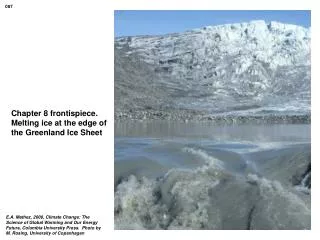
Greenland Ice Sheet (GrIS): Runoff Source: R. Greve, University of Hikkaido. Water balance equation: P – (E + Su) – R±ΔS = 0 ± η P = precipitation, E = evaporation, Su = sublimation, R = runoff/calving, ΔS = change in storage (snow/ice), and η = error.
Simulated GrIS surface melt extent Satellite-derived GrIS surface melt extent, 1979-2008 Source: K. Steffen, University of Colorado. Source: Mernild et al. 2009 (HYP)
Maximum surface melt extent Simulated GrIS surface melt extent and summer mean temperature Source: Mernild et al. in review (GRL) • - Increasing melting period since 1972 of approximately 40–50 days, • Increasing melting intensity, • A sort of oscillation in melt intensity.
2010 Observed GrIS surface melt duration and frequency Summer 2010 melt frequency in % of total days Difference (days) in summer 2010 melt duration compared to 1979–2007 Source: T. Mote, University of Georgia.
The GrIS 1950-2080 IPCC scenario A1B modeled by the DMI HIRHAM4 RCM (using boundary conditions from ECHAM5 AOGCM) GrIS Surface maximum melt extent We detected an ~90% increase in maximum surface melt extent (0.48×10⁶ km2) from 1950 to 2080. The average 1950–1959 maximum modeled melt extent was 30%, and 56% for 2070–2080. The greatest difference in modeled melt extent occurs in the southern part of the GrIS. To the NW and NE of the GrIS the changes in melt extent are less pronounced. The greatest number of melt days is seen in the south eastern part of the GrIS. The largest change in the number of melt days was visible in the eastern part of the GrIS (~50–70%), and is lower to the west (~20–30%) (1950–2080). The reason is likely the projected change in sea ice extent and thickness in adjacent seas. Source: Mernild et al. 2010 (JHM)
GrIS Surface mass balance, including runoff Source: Mernild et al. 2009 (HYP) Other surface studies: P:635–675 km3 yr-1 R:340–400 km3 yr-1 ΔS:110–310 km3 y-1 Source: Box et al. 2006, Fettweis 2007, Hanna et al. 2008, Ettema et al. 2009. P: 631±32 km3 yr-1 E and SU: 110±14 km3 yr-1 R: 397±62 km3 yr-1 ΔS: 124±83 km3 yr-1 Source: Mernild et al. 2009 (HYP)
The GrIS 1950-2080 IPCC scenario A1B modeled by the DMI HIRHAM4 RCM (using boundary conditions from ECHAM5 AOGCM) GrIS surface conditions: Source: Mernild et al. 2010 (JHM) The rate of SMB loss, lead to an enhanced average loss of 331 km3 through 1950 to 2080, and to an average SMB level of -99 km3 for the period 2070–2080. The GrIS surface freshwater runoff is equivalent to an eustatic rise in sea level, from 0.8±0.1 (1950–1959) to 1.9±0.1 mm sea level equivalent (SLE) yr-1 (2070–2080). The accumulated GrIS freshwater runoff contribution from surface melting equals 160 mm SLE from 1950 through 2080.
The GrIS 1950-2080 IPCC scenario A1B modeled by the DMI HIRHAM4 RCM (using boundary conditions from ECHAM5 AOGCM) Tipping point def.: SMB will loss mass year after year, resulting in its eventual removal (Bamber et al. 2010) Continuously irreversible, for how long time? Source: Mernild et al. 2010 (JHM) Tipping Point: beginning of the 2040s ~1.2°C based on the IPCC A1B modeled by the HIRHAM4 RCM for Arctic. ~0.6°C global. Other studies indicates around 3.0°C or higher (Bamber et al. 2010)
GrIS mass budget and area loss M Source: Allison et al. 2009, updated. Estimates of the net mass budget of the GrIS since 1960. Dotted boxes represent estimates used by IPCC AR4 (IPCC, 2007). The solid boxes are post-AR4 assessments (L = Luthcke et al. 2006, W= Velicogna and Wahr 2006; WT = Wouters et al. 2008; CZ = Cazenave et al. 2009; M = Mernild et al. 2009; V = Velicogna 2009).
GrIS mass budget and area loss Source: Mernild et al. 2010 (TC) Left: Ice discharge observations Helheim - Indicating significant increase in Helheim ice discharge of 13.2 km3 since 2000. • Below: Glacier front ice area loss from the 35 greatest outlet glaciers • 2009/10: 419 km2 (Petermann 290 km2). • Thickness Petermann, average ~0.1 km, loss = ~29 km3 • Since 2000: average 150 km2 yr-1 from front glaciers.
GrIS mass budget and area loss Source: I. Howat, Ohio State University. Left: Ice discharge observations Jakobshavn - Indicating significant increase in Jakobshavn ice discharge of 12.0 km3 since 2000. • Below: Glacier front ice area loss from the 35 greatest outlet glaciers • 2009/10: 419 km2 (Petermann 290 km2). • Thickness Petermann, average ~0.1 km, loss = ~29 km3 • Since 2000: average 150 km2 yr-1 from front glaciers.
Future GrIS mass budget and area loss Based on data from IPCC (the average from seven different climate models) Year 2350:Temperature rise up to 8-10 degrees C, Change in GrIS area up to 25%, volume up to 20%, GrIS contributes to the global sea level rise by up to 1.25 m. The thermal expansion will be another ~1.25 m. The total rise is expected to be up to 2.5 m from the GrIS. 2000 2175 2350 2175 2350 2000 Source: Mernild 2008