Download
1 / 19
260 likes | 582 Vues
Basic Table-top SEM imaging. Imaging concepts Contrast mechanisms – optical Contrast mechanisms – SEM (BSE) Detector geometry – compositional and topographic contrast. Contrast and Brightness.

E N D
Basic Table-top SEM imaging • Imaging concepts • Contrast mechanisms – optical • Contrast mechanisms – SEM (BSE) • Detector geometry – compositional and topographic contrast
Contrast and Brightness Brightness is the intensity of a signal. In a digital grayscale image (such as a black and white photo) the brightness of a pixel is represented by a number. In an 8-bit image, the number can range from 0 to 255. This is 28levels of gray. Contrast is the relative difference in intensity between two areas.
Contrast Mechanisms in “real life” • A contrast mechanism is the physical process that causes an image to have brightness variations. • There are several contrast mechanisms that allow our eyes utilize light to observe the objects around us. The most common are: • Angle contrast – surfaces that directly face a source of illumination are brighter • Shadow contrast – objects that are blocked from the illumination source are dark • Color contrast - compounds in surfaces absorb some wavelengths of light and reflect others. Objects with different composition will generally have different colors. • The human brain automatically and instantly processes these contrast mechanisms to interpret a scene. The best interpretations are possible when our eyes can see all three types of contrast.
Contrast Mechanisms in “real life” – minus color The brightnesses of several regions were measured with an image processing program, ImageJ. Can you identify all three contrast mechanisms in this image? (Hint: all three mechanisms are present)
Contrast Mechanisms in “real life” – minus color Let’s start by looking at these three regions. What’s the contrast mechanism?
Contrast Mechanisms in “real life” – minus color Let’s start by looking at these three regions. What’s the contrast mechanism? A reasonable guess is angle contrast - they are simply angled differently with respect to the illumination source. Our brains recognize that the object is a Rubik’s cube – and this knowledge aids in the interpretation But how do we know that the three regions aren’t different colors? What do you think?
Contrast Mechanisms in “real life” – minus color And what’s up with these regions? What’s the contrast mechanism?
Contrast Mechanisms in “real life” When all three contrast mechanisms can be seen in the photograph, we can be more certain of the interpretation The Table-top SEM is equipped with “eyes” that “see” in black and white. Color information is lost – so you must make inferences based on black and white contrast. Research microscopes usually have an attachment that adds compositional information – so they can “see” in “color.”
Imaging in the Phenom – the Backscattered Electron Detector • The BSEdetector is an annular ring separated into 4 segments • The primary beam passes through the annulus. The detector then intercepts some of the electrons backscattered from the specimen • Addingthe signals from all 4 segments generates compositional contrast or Z contrast • Subtracting one block of segments from another generates topographical contrast
BSE Compo contrast (FULL mode on the Phenom) Primary Beam An atom with more protons in the nucleus (i.e. high Z) will deflect more electrons by higher angles and will thus direct more BSE’s at the detector. This is known as compositional contrast. Note that not all of the backscattered electrons are intercepted by the detector Backscattered electrons Low Z – emits fewer BSEs High Z – emits many BSEs
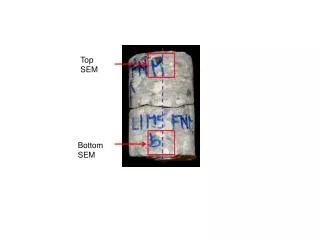
Example: a flat rock surface The rock (a basalt) is composed of many different mineral grains. Each type of mineral has a different composition and therefore a different average Z. Each mineral type therefore has a different average brightness. How many different types of minerals do you see? How many different grains can you count?
BSE Topographic contrast (topo mode) Primary Beam In the illustration, the illuminated surface is angled more towards B than A. Thus side B receives more of the emitted (which contrast mechanism is this?) The two quadrants of side B are subtracted from side A. This creates topographical contrast, which consists of both angle and shadow contrast. Objects that face towards side A will be brighter than those that face side B. This also cancels out the Z contrast (why? We’ll come back to that) Side B Side A Specimen with topographic variation
Subtracting BSD segments for topo contrast This is the same area on the same rock as the one you just saw. The specimen’s Z contrast has been subtracted out, and contrast is therefore due to angle and shadow contrast. We can see that the surface is flat but rough.
Compare Topoand FULL modes Topo A mode BSE compo Note that compo (FULL) mode cancels out much of the topographical (angle and shadow) contrast!!
Orienting the topographical shadingPhenom images of a chicken bone Topo B – shadows oriented to the right Topo A – shadows oriented to the bottom of the image
Watch out for weird subtraction artifacts in topo mode . . . . Topo mode – deep holes appear to be “filled” FULL mode – notice the deep holes
So how does this work? detector • To understand how to get compositional and topographical modes out of the same detector, we have think about the signal that a detector collects. • In the illustration at left, we see that when the beam illuminates the high Z material, the detector collects about twice as many backscattered electrons as when the beam illuminates the low Z material. • We can plot the detector output vs beam location to graphically see the image brightness as the beam scans across the sample detector output beam position High Z Low Z
Adding BSD segments for compositional contrast Side A Side B • In the case illustrated at right, each detector collects about three times as much signal from the high Z material as from the low Z material. In other words, when the beam is on the left side of the specimen, both detectors simultaneously receive a strong signal. When the beam is on the right (green) side of the specimen, both detectors simultaneously receive a weak signal. • Adding the detector outputs (FULL mode) increases this compositional contrast. • Subtracting one output from the other gives no contrast. Thus, Topo mode cancels out the compositional contrast. High Z Low Z Signal A Signal B detector output A+B (FULL) A-B (Topo) beam position
Subtracting signals for topographic contrast A B • In the case illustrated at right, the specimen has a raised feature. When the beam is aimed at the left side of this feature, detector A receives a strong signal while detector B receives a weak signal. The situation is reversed when the beam is aimed at the right side of the feature. • Adding the detector outputs cancels out this topographicalcontrast. • Subtracting one output from the other increases the topographical contrast specimen Signal A Signal B A+B A-B