Download
1 / 48
480 likes | 658 Vues
LIFECYCLES OF STARS. Option 2601. Stellar Physics. Unit 1 - Observational properties of stars Unit 2 - Stellar Spectra Unit 3 - The Sun Unit 4 - Stellar Structure Unit 5 - Stellar Evolution Unit 6 - Stars of particular interest. Unit 2. Stellar Spectra. Unit 1 Slides and Notes.

E N D
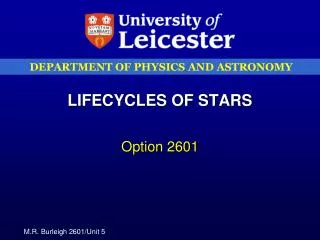
LIFECYCLES OF STARS Option 2601
Stellar Physics • Unit 1 - Observational properties of stars • Unit 2 - Stellar Spectra • Unit 3 - The Sun • Unit 4 - Stellar Structure • Unit 5 - Stellar Evolution • Unit 6 - Stars of particular interest
Unit 2 Stellar Spectra
Unit 1 Slides and Notes • Reminder, can be found at… • www.star.le.ac.uk/~mbu/lectures.html • In case of problems see me in lectures or email me… mbu@star.le.ac.uk
Book Chapters • Zeilik and Gregory • Part II, Chapters 8,10-13, • Part III, Chapters 15-18 • Phillips • Chapters 1-6
Stellar Spectra • Review of atomic physics • Absorption and emission processes • Qualitative treatment of spectral line formation • Atmospheric opacity • Spectral classification of stars • Hertzsprung-Russell diagram • Atmosphere models
Bohr postulate: Energy of orbits: Basic Atomic Physics Bohr atom – quantized orbits NB. It is –ve i.e. bound As n , E 0
E = h Emission: Absorption: Frequency of photon: Quantized Radiation Electron transition between orbits If na > nb
Quantized Radiation • Emission – transition from higher to lower orbit • Absorption – transition from lower to higher orbit • 1 quantum emitted or absorbed • electron can jump over several levels • Can cascade to lower orbit emitting several photons of intermediate energy
The Rydberg constant (10.96776m-1) Lyman : Example for hydrogen Example: Lyman series = 1216Å (121.6nm)
Important Terms • Bound electrons – in orbits around atoms • Free electrons – not in orbits associated with individual atoms
Excitation Atoms can be excited (increase in energy) • Radiatively – by absorption of a photon • Collisional – by a free particle (electron/atom)... • Returns by emitting a photon • Line formation – decay of radiatively excited states
De-excitation • Atoms remain excited for very short times (~10-8 seconds) • Atoms always interacting, cause excited atom to jump spontaneously to lower level • Radiative de-excitation – emission of photon • Collisional de-excitation – colliding particle gains kinetic energy
Ionization Liberation of an electron: + energy + + e- Energy required = ionisation potential e.g. for hydrogen 13.6eV for the ground state:
Ion notation • Chemical notation - + or ++ etc. • but ++++++++ would be silly! • Spectroscopic notation - (I), (II) etc. • e.g. neutral atoms… HI, HeI, CI • Singly ionized… HII (H+), HeII (He+) • Doubly ionized… CIII (C++), NIII
Spectra • Bound transitions absorption at discrete wavelengths series limit • e.g. Lyman (n=1), Balmer (n=2), Paschen (n=3), Brackett (n=4), Ffund (n=5) • Lyman limit at 13.6eV = 91.2nm
Wave number Spectra of atoms/ions • Very similar except for effects of charge • Transitions give rise to emission or absorption features in spectra Z = value of the ionisation state
Spectra of molecules Spectra can arise from • Electronic energy states from combined electron cloud • Internuclear distances quantised into “vibrational” energy states • Quantised rotational energy Appear as bands in spectra
Equivalent width Pressure Doppler effects in gas Equal areas 0 Spectral Lines Spectral line intensities – equivalent width Line strength area of the line in the plot (absorption) This can be represented by ‘equivalent width’
Mean kinetic energy of a gas particle: Boltzmann’s equation: NB / NA = excitation ratio N = number density of state g = multiplicity E = energy of level Excitation equilibrium No of transitions depends on population of energy state From which the transition occurs Level populations depend upon temperature Thermal equilibrium mean no of atoms in given states constant
Saha equation: Ionization equilibrium Population of ions also depends on temperature Ni+1 = higher ion number density Ni = lower ion number density A = constant incorporating atomic data i = ionisation potential of ion i Ne = electron density
Local thermodynamic equilibrium • Combination of Boltzmann & Saha eqns specify state of gas completely • Iteration for each state and level • Plasma where all populations specified by T and Ne is said to be in Local Thermodynamic Equilibrium (LTE) • Often assumed as an approximation in atmosphere modelling
Spectral Classification Division of stars into groups depending upon features in their spectra • Angelo Secchi (1863) found different types, but ordering difficult • Annie J. Cannon (1910) developed Harvard scheme H Balmer strengths • Later re-arranged in order of decreasing temperature (see Saha & Boltzman eqns)
Harvard scheme • Seven letters – O B A F G K M (L T) • Each subdivided from 0 to 9 • e.g. Sun has spectral type G2 Mnemonic – Only Bold Astronomers Forge Great Knowledgeable Minds or the 1950s/Katy Perry version - Oh Be A Fine Girl Kiss Me
O B A F G K M Absorption spectra
Stellar Spectra Spectral Type
The Sun Vega
Luminosity Classification Observers noted differences in spectral line shapes • Narrow lines star more luminous • Morgan & Keenan 6 luminosity classes • e.g. Sun is a G2 V star
Stellar Spectra Luminosity Class
Colour/Magnitude diagram Hertzsprung-Russell (H-R) diagram • Plot luminosity vs. spectral type • Plot magnitude vs. colour… same idea but different parameters • Colour measures changes in spectral shape
Important equations Bohr postulate: n = 1, 2, 3 Energy of orbits: Transition wavelength: R = Rydberg constant = 10.96776m-1
Boltzmann’s equation: N = number density of state g = multiplicity E = energy of level Saha equation: Ni+1 = number density of the higher ion Ni = number density of the lower ion A = constant incorporating atomic data i = ionisation potential of ion I Ne = electron density
= Rosseland mean opacity Atmosphere Models Flux is constant: Scale height of the atmosphere is << R*, so we can represent the atmosphere as a plane parallel layer of infinite extent Equation of radiative transfer:
= optical depth h > 0 = 0 d > 0 h = 0 > 0 Flux equation:
Constant Flux is constant so we can integrate: Calculate q from the boundary conditions: P(r) = P(r = surface) at = 0
Surface Assume that locally the radiation field is a Planck function. At the stellar surface, radiation outflow is in one direction – outwards. Surface radiation pressure is half that given by the Planck formula. and: 1st simple model equation This gives T as a function of (Rosseland mean optical depth)
Surface gravity And dividing by gives: To complete the model add hydrostatic equilibrium to find pressure and density distribution: Variation in h is small compared to R Matm << M M(r) = M and r = R
Schematic model atmosphere calculation INITIAL MODEL e.g. Grey approximation T, structure CALCULATE ION AND LEVEL POPULATIONS i.e. solve Saha-Boltzmann equations CALCULATE RADIATIVE TRANSFER LOOP BACK DETERMINE NEW TEMPERATURE STRUCTURE If differences are large i.e. > some limit SOLVE EQUATION OF HYDROSTATIC EQUILIBRIUM COMPARE NEW MODEL WITH OLD If differences are small END
Stellar Spectra • Review of atomic physics • Absorption and emission processes • Qualitative treatment of spectral line formation • Atmospheric opacity • Spectral classification of stars • Hertzsprung-Russell diagram • Atmosphere models
Unit 2 Stellar Spectra
LIFECYCLES OF STARS Option 2601