Download
1 / 38
380 likes | 513 Vues
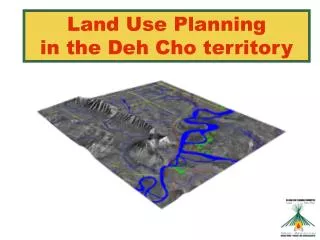
Land atmosphere interaction – metrics and examples. Bart van den Hurk (KNMI/IMAU). Next time assignment (16 May). Identify a new topic that involves land use-climate feedback, and describe the feedback processes using the diagram qualitatively, e.g. green roofs in cities irrigation

E N D
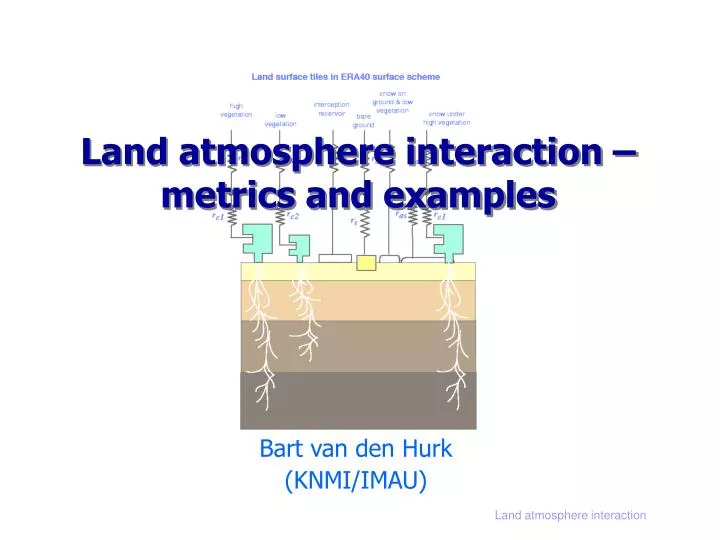
Land atmosphere interaction – metrics and examples Bart van den Hurk (KNMI/IMAU) Land atmosphere interaction
Next time assignment (16 May) • Identify a new topic that involves land use-climate feedback, and describe the feedback processes using the diagram qualitatively, e.g. • green roofs in cities • irrigation • crop disease • ... Land atmosphere interaction
Metrics and examples • How to ‘measure’ land-atmosphere feedback? • From budget analysis: feedback numbers (p, ) • From statistical analysis: coupling coefficient • From physical analysis: anecdotal evidence from (model) experiments • Diagnosis of from ensemble model experiments • Global • Regional (European) • Some (model) experiments explaining mechanisms • Charney’s feedback hypothesis • Regional climate model simulations Europe and USA • Penman-Monteith coupled to PBL model • Convective triggering Land atmosphere interaction
The coupling coefficient • What is the contribution of the interactive land-atmosphere coupling on the hydrological cycle? • How to answer? • Simple. Simulate the hydrological cycle without interactive land-atmosphere coupling and compare. • How? • Simple. Replace interactive landsurface flux/state by something that is prescribed and not interactive. • How to distinguish between interactive and prescribed landsurface? • Ensemble simulations Land atmosphere interaction
The coupling coefficient • Two ensembles of 16 model simulations, with varying atmosphere for each member • One ensemble (W) ‘normal’ (full coupling between land and atmosphere) • soil moisture from member one is written every time step • One ensemble (S) with varying atmosphere prescribed soil moisture • soil moisture from each member is read from W1 • Evaluate ensemble variance of precipitation Koster et al, 2004, Science Land atmosphere interaction
Effect on precipitation All simulations in ensemble respond to the land surface boundary condition in the same way strong coupling Simulations in ensemble have no coherent response to the land surface boundary condition weak coupling Koster et al, 2004, Science Land atmosphere interaction
Definition of (simplified version) • Take variance of precipitation across ensemble, P2 • Compare P2 from ensemble W with ensemble S • If P2(W) P2(S) 0, low coupling • If P2(S) disappears 1, strong coupling Koster et al, 2004, Science Land atmosphere interaction
Major result, mean over 12 GCMs Koster et al, 2004, Science Land atmosphere interaction
When strong positive hydrological feedback likely? ET→P W→ET climate transition zones sensitivity Arid Humid wet dry Land atmosphere interaction
Similar exp, not an ensemble but multiyear simulation • Compare two multi-year simulations: • One normal (‘coupled’) simulation • One ‘uncoupled’ simulation with fixed land cond’s • See what is the effect on variability of T, P soil water precipitation Land atmosphere interaction
Land-atmosphere coupling in Europe: climate change scenario Precipitation • Change in interannual variability • T,p2(future) - T,p2(control) Temperature Coupled Uncoupled Seneviratne et al, 2006, Nature Land atmosphere interaction
Temperature extremes in Europe • Various runs with an RCM covering 1959-2006 • a cooling period 1959-1980 • a warming between 1981-2006 • Cut land-atmosphere interaction by prescribing time-filtered soil moisture using different time scales • Check the trends in these periods for different filtering time scales IAV = interannual variability removed Jaeger et al (2010) Land atmosphere interaction
Results in trends Thus: cutting land-atmosphere interaction affects trends in Tmax Also feedbacks with cloud cover play a role Land atmosphere interaction
Chasing the coupling mechanisms: other model experiments with on/off switches 2 different land surface models giving different precipitation (USGS better than SiB) Kanamitsu and Mo, 2003, J.Clim Land atmosphere interaction
Is it the local land-atmosphere feedback? • Also different flow patterns (USGS follows more western and more humid pathway) • Additional experiments • 20km RCMs (local physics) nested in 50km models giving lateral boundary conditions • USGS-USGS • USGS-SiB • SiB-USGS • SiB-SiB Kanamitsu and Mo, 2003, J.Clim Land atmosphere interaction
Results P E land USGS, atmUSGS Atmospheric forcing has larger impact on both E and P than land surface model land USGS, atmSiB land SiB, atmUSGS Kanamitsu and Mo, 2003, J.Clim Land atmosphere interaction
Coupled Penman-Monteith equation • Consider the following system: • And the Penman-Monteith equation: A = (1-)Sin + Lin-Lout D = qsat(T) – q = dqsat/dT Van Heerwaarden et al, 2010 Land atmosphere interaction
Derivative dLE/dt Forcing Feedback Heating/moistening through advection Change of radiation in time Changes in aerodynamic coupling due to stability effects Heating/moistening through boundary layer growth Soil moisture depletion Longwave cooling Soil heating A = (1-)Sin + Lin-Lout D = qsat(T) – q = dqsat/dT Van Heerwaarden et al, 2010 Land atmosphere interaction
Results for Cabauw and Niamey Van Heerwaarden et al, 2010 Land atmosphere interaction
Physical processes related to precipitation • Cloud formation • Factors generating rising air Land atmosphere interaction
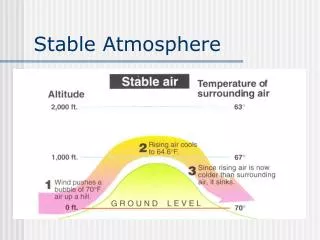
Rising air and condensation Rising air cools with 1 K per 100m ……….. Until it becomes so cold that it starts to condensate… rising air rising air water vapour condensates to droplets water vapour molecules And a cloud is born!!! Land atmosphere interaction sheets from Pier Siebesma, KNMI
Conditions for precipitation Necessary (but not sufficient) condition: Low Level Moisture Convergence Land atmosphere interaction
Examples of Moist Convergence Mid-latitudes : Low pressure Systems Tropics: Intertropical Convergence Zone (ITCZ) Land atmosphere interaction
Causes of rising air:1. Orography Lenticularis above Mount Etna seen from Taormina, Sicily Italy. Land atmosphere interaction
2. Convection • The sun heats the soil so that…….. • Thermals are formed…. • that rise because of buoyancy…. • And a cloud forms as a wig on top of an invisible man 24-07-2006 12:30 Amsterdam: cumulus humilis or “fair weather” cumulus www.sky-catcher.nl Land atmosphere interaction
Condensational Heating allows cumulus to grow • Wolken top (~3 km) • Humidity condensates into cloud water….. • And produces latent heat • Which serves as onboard fuel that allows the cloud to rise further….. • With ~5 m/s…. • Until the cloud is stopped by a temperature inversion. • Wolken basis (~1km) 24-07-2006 Amsterdam: cumulus mediocris. 15:30 Land atmosphere interaction
Poor man’s cloud model: adiabatic ascent Mean profile “Level of zero kinetic energy” Inversion Level of neutral buoyancy (LNB) non-well mixed layer height Level of free convection (LFC) Lifting condensation level (LCL) well mixed layer Land atmosphere interaction
Convection in the (sub)tropics } Hadley circulation Land atmosphere interaction
Cartoon of Hadley Circulation Tropopause 10km Subsidence ~0.5 cm/s inversion 10 m/s Cloud base ~500m • Shallow Convective Clouds • No precipitation • Vertical turbulent transport • No net latent heat production • Fuel Supply Hadley Circulation • Stratocumulus • Interaction with radiation • Deep Convective Clouds • Precipitation • Vertical turbulent transport • Net latent heat production • Engine Hadley Circulation Land atmosphere interaction
3. Large Scale Lifting through fronts } Occuring at mid-latitudes } Land atmosphere interaction
Convection and land-atmosphere coupling • Findell and Eltahir (2003) did a systematic analysis of soil moisture – precipitation feedback • Start with atm. sounding of 6:00 am • Use simple Land-PBL model driven by obs. soundings • Diagnose convective triggering or shallow cumulus formation for 2 runs (dry and wet soil) • Classes of cases: • soil has no impact (atm. controlled) • convection favoured over wet soils • convection favoured over dry soils Land atmosphere interaction
Soil-PBL feedback • Dry soils favoring convection (negative feedback) • Wet soils favoring convection (positive feedback) dry wet PBL growth reaches LCL LCL LCL Build-up of MSE gives convective potential LCL LCL Land atmosphere interaction
Findell’s diagnostics • Convective Triggering Potential (CTP) • Dewpoint depression in low levels (HIlow): • too wet: rain always likely • too dry: no moisture available Land atmosphere interaction
Findell’s map of feedback Land atmosphere interaction
Soil moisture – precipitation feedbackdiagnosed from RCM • Comparison RCM at 25km (convection parameterized) to a 2km run (resolved convection) • Three runs: CTL, dry soil, wet soil. precipitation time (UTC) PCTL positive feedback (Pwet-Pdry) PCTL negative feedback Hohenegger et al, 2009 Land atmosphere interaction
Cloud cover resolved parameterized morning cloud cover radiative cooling stabilization difficult for convection wet higher pbl moisture content extra fuel in convective closure scheme dry spec.hum. Hohenegger et al, 2009 Land atmosphere interaction
Next week: Design an experiment • Consider the 2003 heatwave in Europe. • And consider a GCM with which you can make seasonal forecasts • What kind of land surface processes could affect this heatwave (extended in time, intensified) • What kind of experiment would you design to demonstrate this role of land surface processes? Land atmosphere interaction
More information • Bart van den Hurk • hurkvd@knmi.nl Land atmosphere interaction